
- Start >
- Rivers >
- Discharge >
- Unterer Main >
- Bad Brückenau >
- Chart of year

Chart of year Bad Brückenau / Sinn
Discharge from 27.04.2024 to 26.04.2025
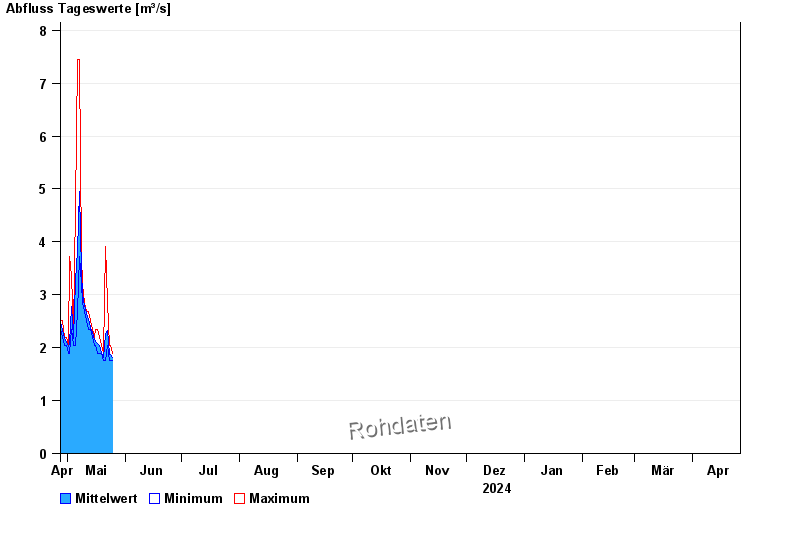
| Date | Mean value [m³/s] | Maximum [m³/s] | Minimum [m³/s] |
|---|---|---|---|
| 05.05.2024 | 3.38 | 4.67 | 2.04 |
| 04.05.2024 | 2.17 | 2.35 | 2.04 |
| 03.05.2024 | 2.77 | 3.37 | 2.35 |
| 02.05.2024 | 2.07 | 3.73 | 1.89 |
| 01.05.2024 | 2.03 | 2.04 | 1.89 |
| 30.04.2024 | 2.1 | 2.19 | 2.04 |
| 29.04.2024 | 2.19 | 2.19 | 2.04 |
© Bayerisches Landesamt für Umwelt 2024