
- Start >
- Rivers >
- Discharge >
- Unterer Main >
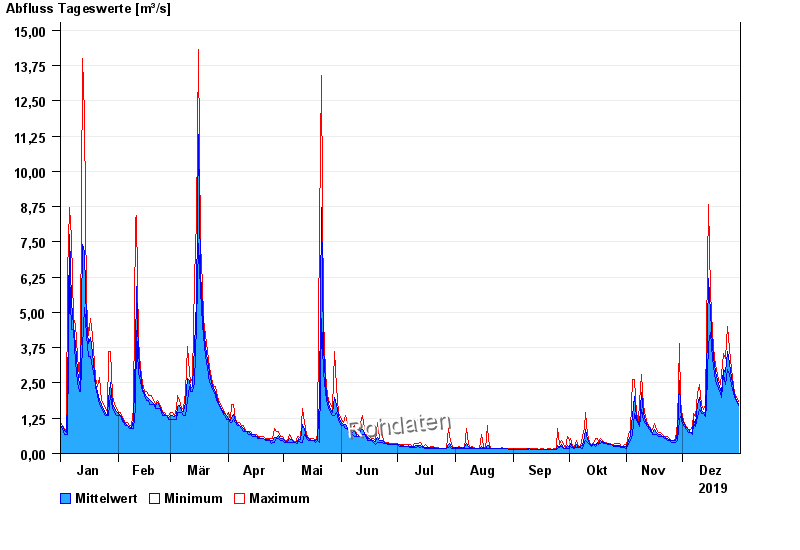
- Bad Brückenau >
- Chart of year

Chart of year Bad Brückenau / Sinn
Discharge from 01.01.2019 to 31.12.2019
| Date | Mean value [m³/s] | Maximum [m³/s] | Minimum [m³/s] |
|---|---|---|---|
| 31.12.2019 | 1.78 | 1.84 | 1.7 |
| 30.12.2019 | 1.89 | 1.99 | 1.84 |
| 29.12.2019 | 2.08 | 2.14 | 1.99 |
| 28.12.2019 | 2.34 | 2.46 | 2.14 |
| 27.12.2019 | 2.68 | 2.98 | 2.46 |
| 26.12.2019 | 3.2 | 3.72 | 2.8 |
| 25.12.2019 | 3.61 | 4.5 | 2.98 |
© Bayerisches Landesamt für Umwelt 2024