
- Start >
- Rivers >
- Discharge >
- Unterer Main >
- Atzhausen >
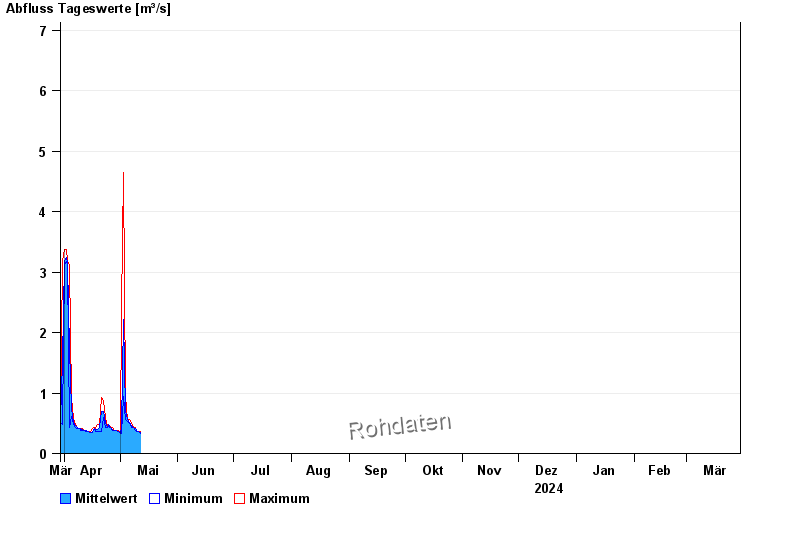
- Chart of year

Chart of year Atzhausen / Castellbach
Discharge from 30.03.2024 to 29.03.2025
- 31.05.2013 Abfluss: 49,8 m³/s
- 09.07.2021 Abfluss: 46,1 m³/s
- 31.12.1981 Abfluss: 46,1 m³/s
- 01.06.2013 Abfluss: 31 m³/s
- 06.06.1984 Abfluss: 30,8 m³/s
| Date | Mean value [m³/s] | Maximum [m³/s] | Minimum [m³/s] |
|---|---|---|---|
| 28.04.2024 | 0.366 | 0.366 | 0.366 |
| 27.04.2024 | 0.39 | 0.411 | 0.366 |
| 26.04.2024 | 0.412 | 0.435 | 0.411 |
| 25.04.2024 | 0.458 | 0.461 | 0.435 |
| 24.04.2024 | 0.412 | 0.435 | 0.411 |
| 23.04.2024 | 0.486 | 0.578 | 0.411 |
| 22.04.2024 | 0.675 | 0.853 | 0.578 |
© Bayerisches Landesamt für Umwelt 2024