
- Start >
- Rivers >
- Discharge >
- Unterer Main >
- Arnstein >
- Chart of year

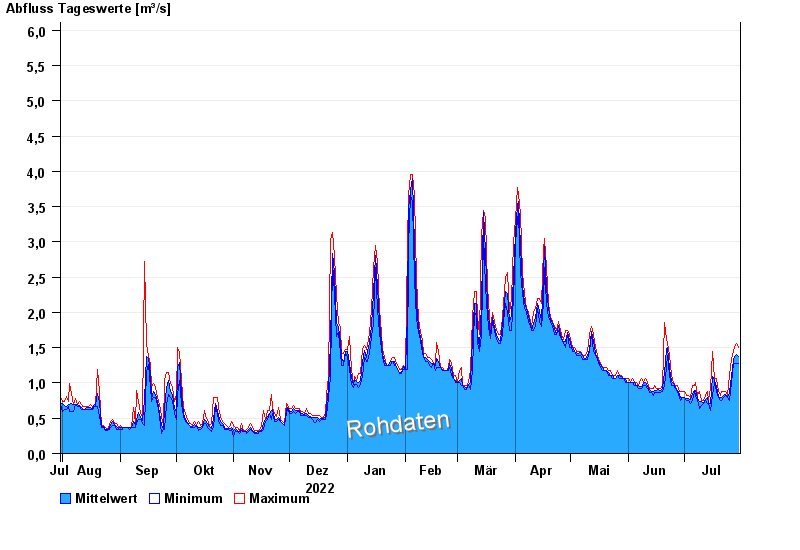
Chart of year Arnstein / Wern
Discharge from 31.07.2022 to 30.07.2023
- 26.01.1995 Abfluss: 26,7 m³/s
- 03.07.2009 Abfluss: 26,3 m³/s
- 01.06.2013 Abfluss: 24,3 m³/s
- 06.01.1982 Abfluss: 24,2 m³/s
- 03.01.2003 Abfluss: 23,6 m³/s
| Date | Mean value [m³/s] | Maximum [m³/s] | Minimum [m³/s] |
|---|---|---|---|
| 30.07.2023 | 1.37 | 1.5 | 1.27 |
| 29.07.2023 | 1.41 | 1.56 | 1.27 |
| 28.07.2023 | 1.38 | 1.5 | 1.27 |
| 27.07.2023 | 1.32 | 1.44 | 1.27 |
| 26.07.2023 | 1.1 | 1.33 | 1.01 |
| 25.07.2023 | 0.867 | 1.11 | 0.752 |
| 24.07.2023 | 0.8 | 0.828 | 0.789 |
© Bayerisches Landesamt für Umwelt 2024