
- Start >
- Rivers >
- Discharge >
- Unterer Main >
- Arnstein >
- Chart of year

Chart of year Arnstein / Wern
Discharge from 01.01.2021 to 31.12.2021
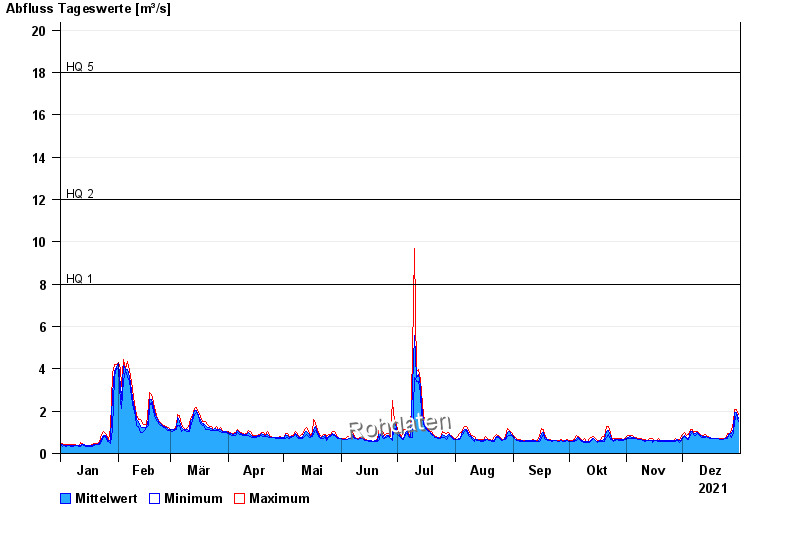
- HQ1 8 m³/s
- HQ2 12 m³/s
- HQ5 18 m³/s
- HQ10 22 m³/s
- HQ20 26 m³/s
- HQ50 32 m³/s
- HQ100 37 m³/s
| Date | Mean value [m³/s] | Maximum [m³/s] | Minimum [m³/s] |
|---|---|---|---|
| 31.12.2021 | 1.64 | 1.82 | 1.51 |
| 30.12.2021 | 1.96 | 2.08 | 1.82 |
| 29.12.2021 | 1.93 | 2.08 | 1.51 |
| 28.12.2021 | 1.18 | 1.46 | 0.977 |
| 27.12.2021 | 0.925 | 1.07 | 0.763 |
| 26.12.2021 | 0.922 | 0.928 | 0.886 |
| 25.12.2021 | 0.822 | 0.928 | 0.721 |
© Bayerisches Landesamt für Umwelt 2024