
- Start >
- Rivers >
- Discharge >
- Unterer Main >
- Arnstein >
- Chart of year

Chart of year Arnstein / Wern
Discharge from 01.01.2018 to 31.12.2018
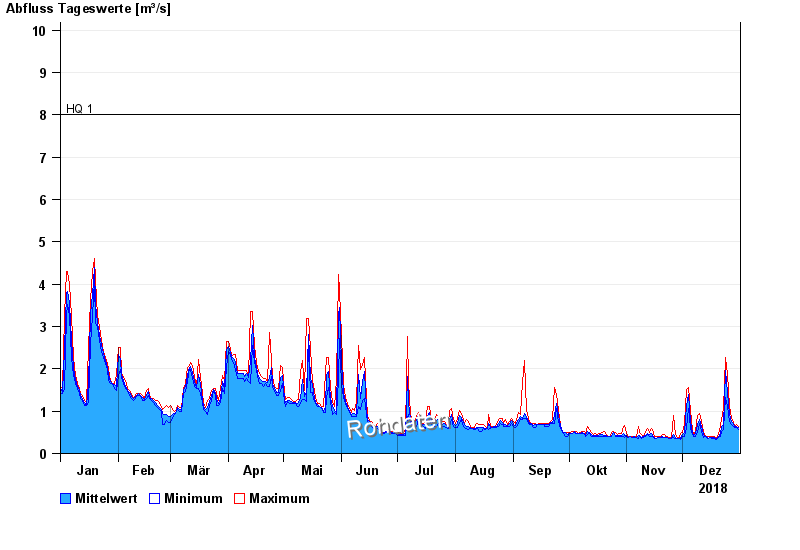
- HQ1 8 m³/s
- HQ2 12 m³/s
- HQ5 18 m³/s
- HQ10 22 m³/s
- HQ20 26 m³/s
- HQ50 32 m³/s
- HQ100 37 m³/s
| Date | Mean value [m³/s] | Maximum [m³/s] | Minimum [m³/s] |
|---|---|---|---|
| 31.12.2018 | 0.617 | 0.642 | 0.578 |
| 30.12.2018 | 0.648 | 0.676 | 0.609 |
| 29.12.2018 | 0.637 | 0.642 | 0.609 |
| 28.12.2018 | 0.704 | 0.752 | 0.642 |
| 27.12.2018 | 0.75 | 0.828 | 0.676 |
| 26.12.2018 | 0.919 | 1.11 | 0.752 |
| 25.12.2018 | 1.45 | 1.86 | 1.11 |
© Bayerisches Landesamt für Umwelt 2024