
- Start >
- Rivers >
- Discharge >
- Unterer Main >
- Arnstein >
- Chart of year

Chart of year Arnstein / Wern
Discharge from 28.10.2021 to 27.10.2022
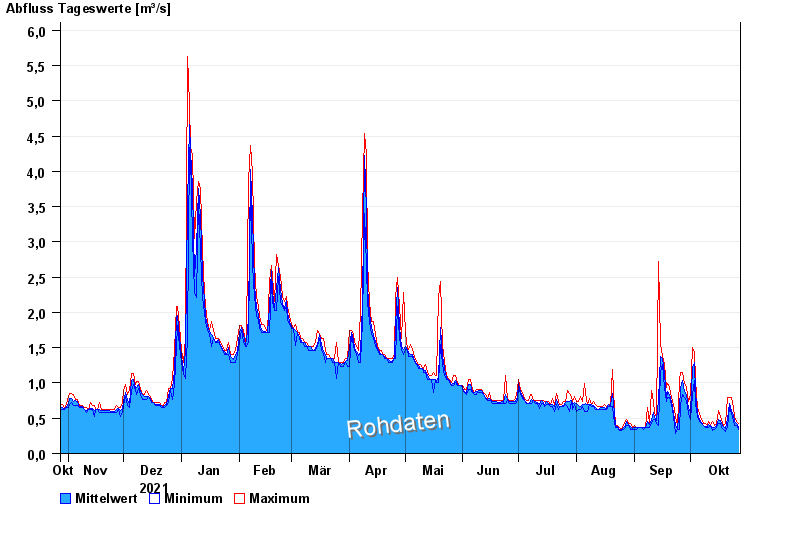
| Date | Mean value [m³/s] | Maximum [m³/s] | Minimum [m³/s] |
|---|---|---|---|
| 27.10.2022 | 0.372 | 0.426 | 0.347 |
| 26.10.2022 | 0.419 | 0.455 | 0.395 |
| 25.10.2022 | 0.459 | 0.525 | 0.395 |
| 24.10.2022 | 0.54 | 0.645 | 0.455 |
| 23.10.2022 | 0.604 | 0.787 | 0.562 |
| 22.10.2022 | 0.704 | 0.787 | 0.645 |
| 21.10.2022 | 0.493 | 0.787 | 0.37 |
© Bayerisches Landesamt für Umwelt 2024