
- Start >
- Rivers >
- Discharge >
- Unterer Main >
- Arnstein >
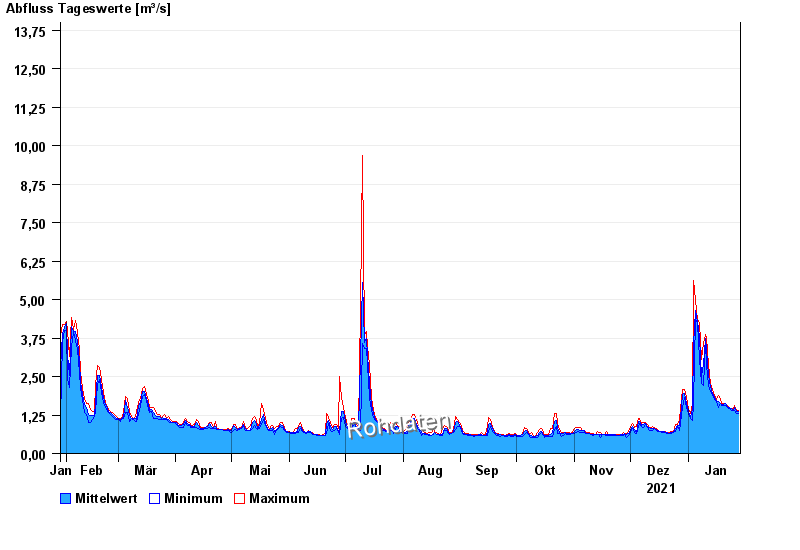
- Chart of year

Chart of year Arnstein / Wern
Discharge from 29.01.2021 to 28.01.2022
- 26.01.1995 Abfluss: 26,7 m³/s
- 03.07.2009 Abfluss: 26,3 m³/s
- 01.06.2013 Abfluss: 24,3 m³/s
- 06.01.1982 Abfluss: 24,2 m³/s
- 03.01.2003 Abfluss: 23,6 m³/s
| Date | Mean value [m³/s] | Maximum [m³/s] | Minimum [m³/s] |
|---|---|---|---|
| 28.01.2022 | 1.36 | 1.4 | 1.29 |
| 27.01.2022 | 1.37 | 1.4 | 1.29 |
| 26.01.2022 | 1.5 | 1.57 | 1.4 |
| 25.01.2022 | 1.41 | 1.46 | 1.4 |
| 24.01.2022 | 1.45 | 1.46 | 1.4 |
| 23.01.2022 | 1.48 | 1.51 | 1.46 |
| 22.01.2022 | 1.53 | 1.57 | 1.51 |
© Bayerisches Landesamt für Umwelt 2024