
- Start >
- Rivers >
- Discharge >
- Unterer Main >
- Arnstein >
- Chart of year

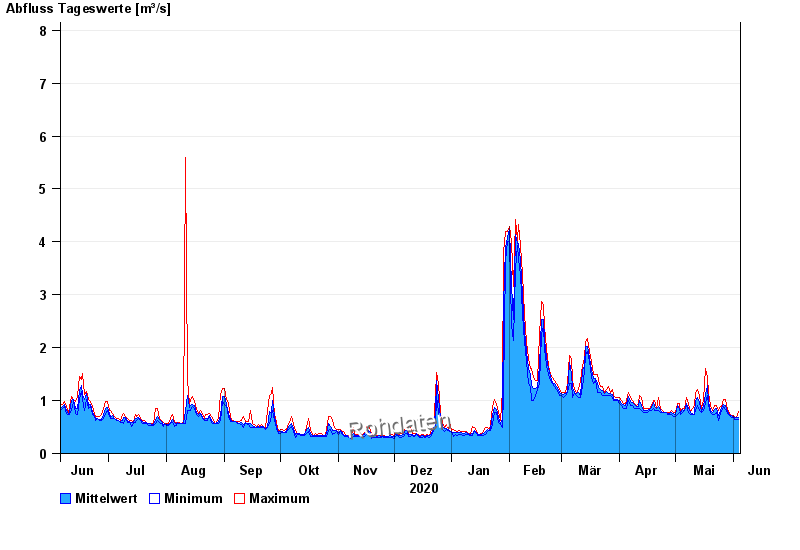
Chart of year Arnstein / Wern
Discharge from 05.06.2020 to 04.06.2021
- 26.01.1995 Abfluss: 26,7 m³/s
- 03.07.2009 Abfluss: 26,3 m³/s
- 01.06.2013 Abfluss: 24,3 m³/s
- 06.01.1982 Abfluss: 24,2 m³/s
- 03.01.2003 Abfluss: 23,6 m³/s
| Date | Mean value [m³/s] | Maximum [m³/s] | Minimum [m³/s] |
|---|---|---|---|
| 04.06.2021 | 0.681 | 0.801 | 0.652 |
| 03.06.2021 | 0.677 | 0.686 | 0.652 |
| 02.06.2021 | 0.684 | 0.686 | 0.652 |
| 01.06.2021 | 0.694 | 0.721 | 0.686 |
| 31.05.2021 | 0.717 | 0.721 | 0.686 |
| 30.05.2021 | 0.74 | 0.763 | 0.721 |
| 29.05.2021 | 0.795 | 0.84 | 0.763 |
© Bayerisches Landesamt für Umwelt 2024