
- Start >
- Rivers >
- Discharge >
- Unterer Main >
- Arnstein >
- Chart of year

Chart of year Arnstein / Wern
Discharge from 01.01.2024 to 31.12.2024
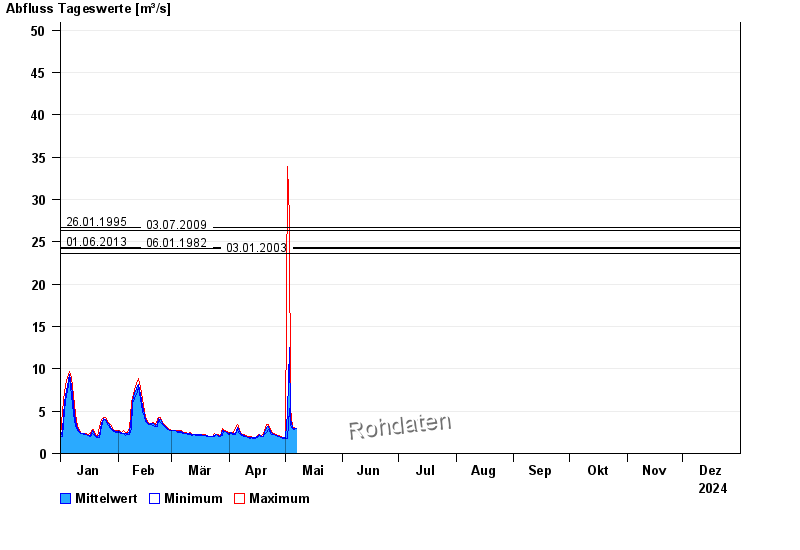
- 26.01.1995 Abfluss: 26,7 m³/s
- 03.07.2009 Abfluss: 26,3 m³/s
- 01.06.2013 Abfluss: 24,3 m³/s
- 06.01.1982 Abfluss: 24,2 m³/s
- 03.01.2003 Abfluss: 23,6 m³/s
| Date | Mean value [m³/s] | Maximum [m³/s] | Minimum [m³/s] |
|---|---|---|---|
| 16.06.2024 | 1.64 | 1.64 | 1.64 |
| 15.06.2024 | 1.61 | 1.71 | 1.47 |
| 14.06.2024 | 1.46 | 1.47 | 1.42 |
| 13.06.2024 | 1.46 | 1.47 | 1.42 |
| 12.06.2024 | 1.5 | 1.53 | 1.47 |
| 11.06.2024 | 1.55 | 1.59 | 1.47 |
| 10.06.2024 | 1.58 | 1.59 | 1.53 |
© Bayerisches Landesamt für Umwelt 2024