
- Start >
- Rivers >
- Discharge >
- Unterer Main >
- Arnstein >
- Chart of year

Chart of year Arnstein / Wern
Discharge from 28.10.2020 to 27.10.2021
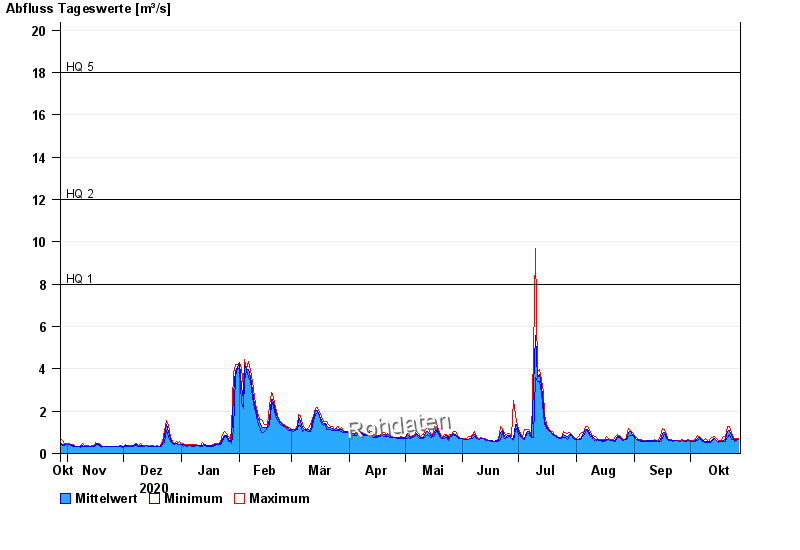
- HQ1 8 m³/s
- HQ2 12 m³/s
- HQ5 18 m³/s
- HQ10 22 m³/s
- HQ20 26 m³/s
- HQ50 32 m³/s
- HQ100 37 m³/s
| Date | Mean value [m³/s] | Maximum [m³/s] | Minimum [m³/s] |
|---|---|---|---|
| 27.10.2021 | 0.666 | 0.693 | 0.658 |
| 26.10.2021 | 0.651 | 0.693 | 0.595 |
| 25.10.2021 | 0.635 | 0.693 | 0.565 |
| 24.10.2021 | 0.693 | 0.764 | 0.658 |
| 23.10.2021 | 0.828 | 0.977 | 0.658 |
| 22.10.2021 | 1.08 | 1.29 | 0.887 |
| 21.10.2021 | 1.05 | 1.29 | 0.764 |
© Bayerisches Landesamt für Umwelt 2024