
- Start >
- Rivers >
- Discharge >
- Unterer Main >
- Arnstein >
- Chart of year

Chart of year Arnstein / Wern
Discharge from 22.09.2020 to 21.09.2021
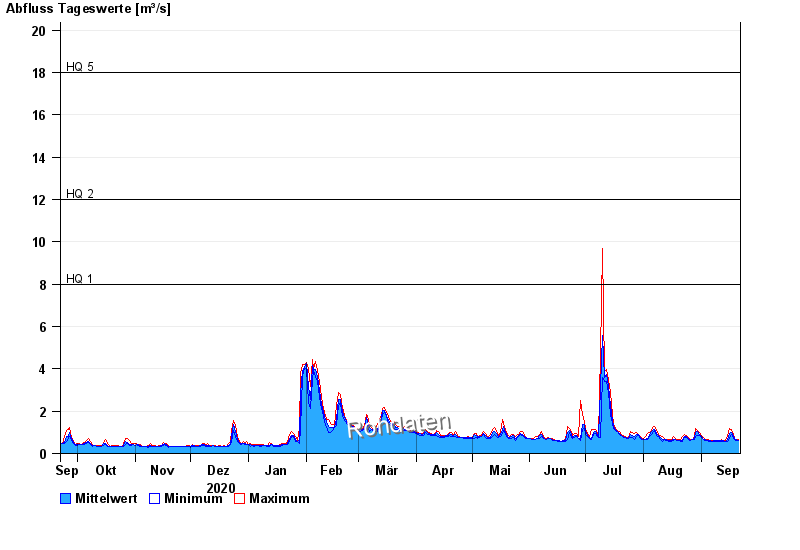
- HQ1 8 m³/s
- HQ2 12 m³/s
- HQ5 18 m³/s
- HQ10 22 m³/s
- HQ20 26 m³/s
- HQ50 32 m³/s
- HQ100 37 m³/s
| Date | Mean value [m³/s] | Maximum [m³/s] | Minimum [m³/s] |
|---|---|---|---|
| 21.09.2021 | 0.631 | 0.658 | 0.595 |
| 20.09.2021 | 0.653 | 0.658 | 0.595 |
| 19.09.2021 | 0.686 | 0.728 | 0.658 |
| 18.09.2021 | 0.814 | 0.887 | 0.728 |
| 17.09.2021 | 0.986 | 1.12 | 0.887 |
| 16.09.2021 | 0.945 | 1.18 | 0.728 |
| 15.09.2021 | 0.675 | 0.863 | 0.577 |
© Bayerisches Landesamt für Umwelt 2024