
- Start >
- Rivers >
- Discharge >
- Unterer Main >
- Arnstein >
- Chart of year

Chart of year Arnstein / Wern
Discharge from 20.06.2021 to 19.06.2022
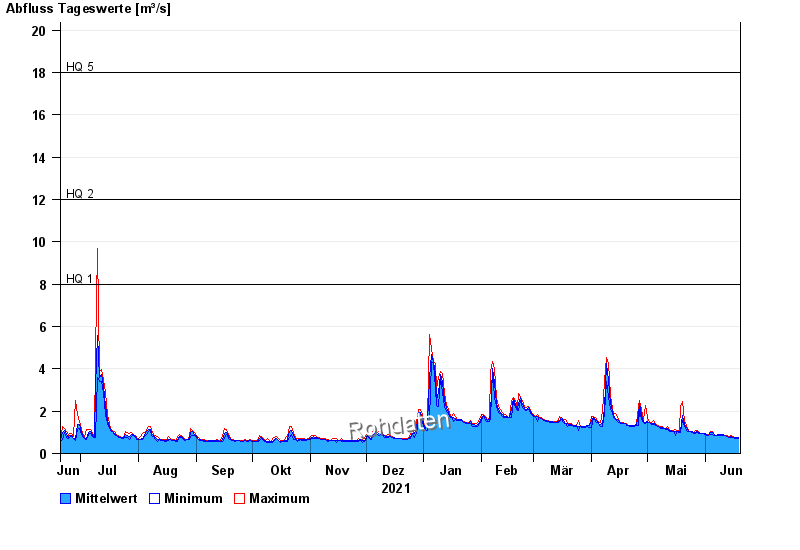
- HQ1 8 m³/s
- HQ2 12 m³/s
- HQ5 18 m³/s
- HQ10 22 m³/s
- HQ20 26 m³/s
- HQ50 32 m³/s
- HQ100 37 m³/s
| Date | Mean value [m³/s] | Maximum [m³/s] | Minimum [m³/s] |
|---|---|---|---|
| 19.06.2022 | 0.734 | 0.749 | 0.713 |
| 18.06.2022 | 0.739 | 0.749 | 0.713 |
| 17.06.2022 | 0.74 | 0.749 | 0.713 |
| 16.06.2022 | 0.762 | 0.786 | 0.749 |
| 15.06.2022 | 0.786 | 0.87 | 0.749 |
| 14.06.2022 | 0.769 | 0.786 | 0.749 |
| 13.06.2022 | 0.796 | 0.83 | 0.786 |
© Bayerisches Landesamt für Umwelt 2024