
- Start >
- Rivers >
- Discharge >
- Unterer Main >
- Arnstein >
- Chart of year

Chart of year Arnstein / Wern
Discharge from 10.08.2020 to 09.08.2021
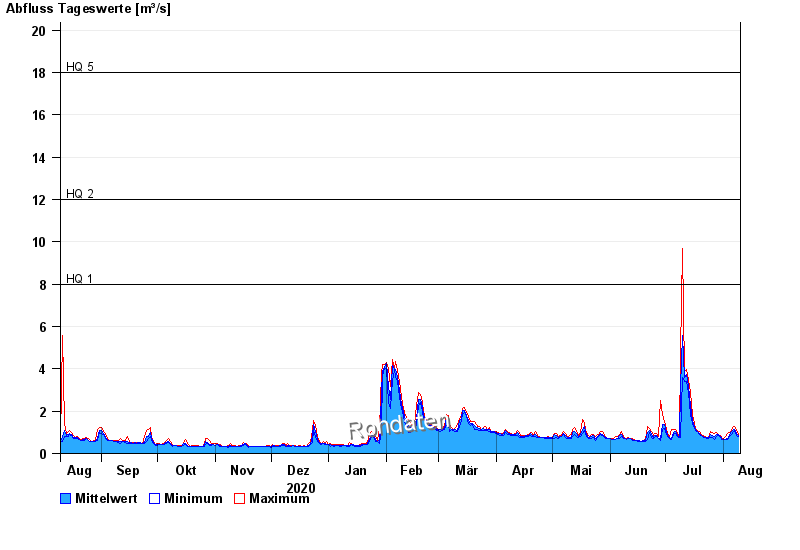
- HQ1 8 m³/s
- HQ2 12 m³/s
- HQ5 18 m³/s
- HQ10 22 m³/s
- HQ20 26 m³/s
- HQ50 32 m³/s
- HQ100 37 m³/s
| Date | Mean value [m³/s] | Maximum [m³/s] | Minimum [m³/s] |
|---|---|---|---|
| 09.08.2021 | 0.843 | 0.91 | 0.785 |
| 08.08.2021 | 0.953 | 1.1 | 0.863 |
| 07.08.2021 | 1.14 | 1.26 | 1.1 |
| 06.08.2021 | 1.15 | 1.26 | 1.05 |
| 05.08.2021 | 1.02 | 1.1 | 0.91 |
| 04.08.2021 | 0.87 | 1 | 0.824 |
| 03.08.2021 | 0.725 | 0.953 | 0.639 |
© Bayerisches Landesamt für Umwelt 2024