
- Start >
- Rivers >
- Discharge >
- Unterer Main >
- Amorbach >
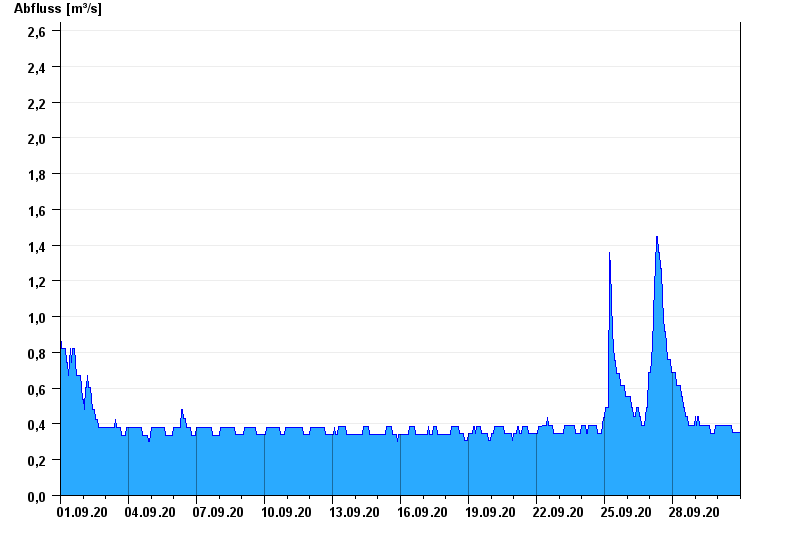
- Chart of month

Chart of month Amorbach / Billbach
Discharge from 01.09.2020 to 30.09.2020
- 04.02.2020 Abfluss: 48,3 m³/s
- 05.01.2018 Abfluss: 33,4 m³/s
- 03.01.2018 Abfluss: 28 m³/s
- 04.01.2022 Abfluss: 24,7 m³/s
- 30.05.2016 Abfluss: 21,8 m³/s
| Date | Runoff [m³/s] |
|---|---|
| 01.10.2020 00:45 | 0.35 |
| 01.10.2020 00:30 | 0.35 |
| 01.10.2020 00:15 | 0.35 |
| 01.10.2020 00:00 | 0.35 |
| 30.09.2020 23:45 | 0.35 |
| 30.09.2020 23:30 | 0.35 |
| 30.09.2020 23:15 | 0.35 |
© Bayerisches Landesamt für Umwelt 2024