
- Start >
- Rivers >
- Discharge >
- Obere Donau >
- Wittislingen >
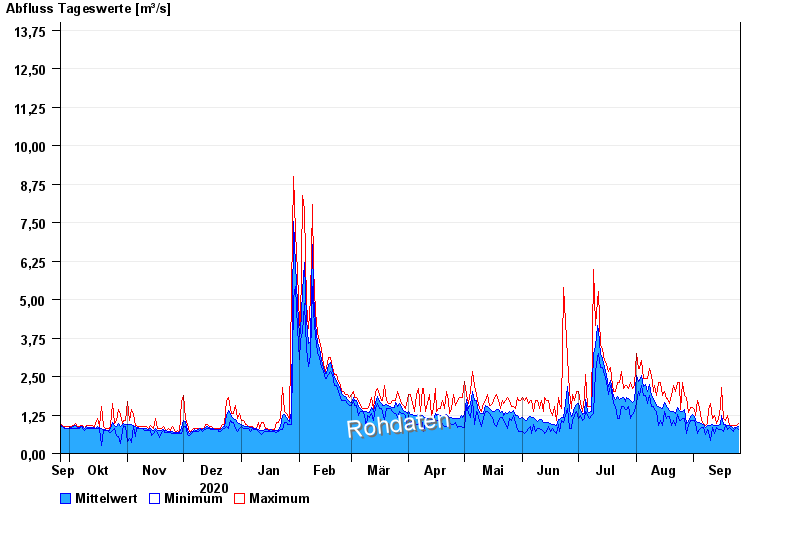
- Chart of year

Chart of year Wittislingen / Egau
Discharge from 26.09.2020 to 25.09.2021
- 14.04.1994 Abfluss: 32,2 m³/s
- 03.03.1956 Abfluss: 27,8 m³/s
- 15.02.1990 Abfluss: 23,6 m³/s
- 06.01.1982 Abfluss: 23,3 m³/s
- 23.03.2002 Abfluss: 21,8 m³/s
| Date | Mean value [m³/s] | Maximum [m³/s] | Minimum [m³/s] |
|---|---|---|---|
| 25.09.2021 | 0.877 | 0.984 | 0.779 |
| 24.09.2021 | 0.856 | 0.92 | 0.844 |
| 23.09.2021 | 0.85 | 0.92 | 0.779 |
| 22.09.2021 | 0.828 | 0.92 | 0.715 |
| 21.09.2021 | 0.866 | 0.92 | 0.779 |
| 20.09.2021 | 0.899 | 0.92 | 0.844 |
| 19.09.2021 | 0.92 | 1.23 | 0.779 |
© Bayerisches Landesamt für Umwelt 2024