
- Start >
- Rivers >
- Discharge >
- Obere Donau >
- Wittislingen >
- Chart of year

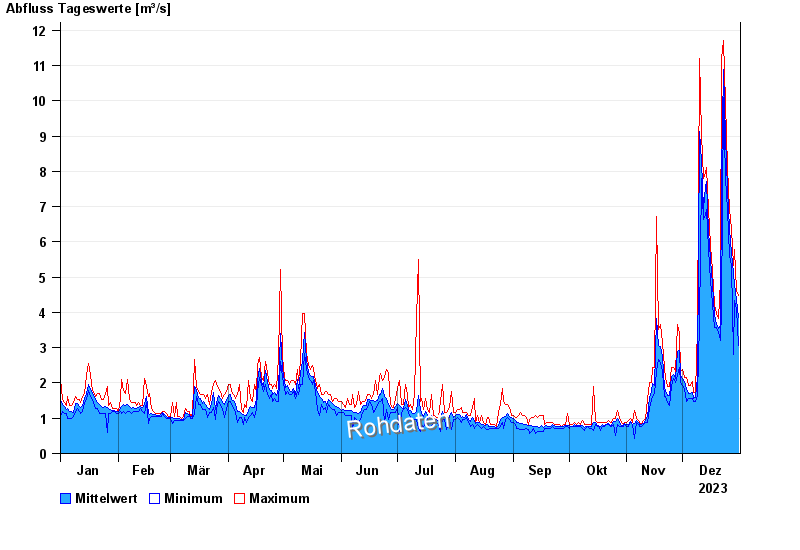
Chart of year Wittislingen / Egau
Discharge from 01.01.2023 to 31.12.2023
| Date | Mean value [m³/s] | Maximum [m³/s] | Minimum [m³/s] |
|---|---|---|---|
| 31.12.2023 | 3.86 | 4.49 | 3.07 |
| 30.12.2023 | 4.36 | 4.63 | 4.09 |
| 29.12.2023 | 4.79 | 5.77 | 4.35 |
| 28.12.2023 | 5.1 | 5.33 | 2.82 |
| 27.12.2023 | 5.69 | 6.35 | 5.33 |
| 26.12.2023 | 6.36 | 6.92 | 5.62 |
| 25.12.2023 | 7.47 | 8.12 | 6.92 |
© Bayerisches Landesamt für Umwelt 2025