
- Start >
- Rivers >
- Discharge >
- Obere Donau >
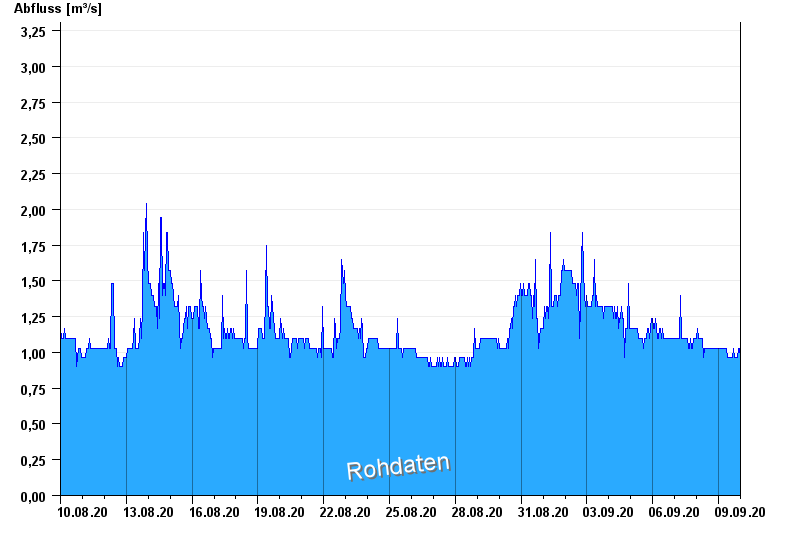
- Wittislingen >
- Chart of month

Chart of month Wittislingen / Egau
Discharge from 10.08.2020 to 09.09.2020
- 14.04.1994 Abfluss: 32,2 m³/s
- 03.03.1956 Abfluss: 27,8 m³/s
- 15.02.1990 Abfluss: 23,6 m³/s
- 06.01.1982 Abfluss: 23,3 m³/s
- 23.03.2002 Abfluss: 21,8 m³/s
| Date | Runoff [m³/s] |
|---|---|
| 10.09.2020 00:45 | 1.03 |
| 10.09.2020 00:30 | 1.03 |
| 10.09.2020 00:15 | 1.03 |
| 10.09.2020 00:00 | 0.964 |
| 09.09.2020 23:45 | 0.964 |
| 09.09.2020 23:30 | 0.964 |
| 09.09.2020 23:15 | 0.964 |
© Bayerisches Landesamt für Umwelt 2024