
- Start >
- Rivers >
- Discharge >
- Obere Donau >
- Wiblingen >
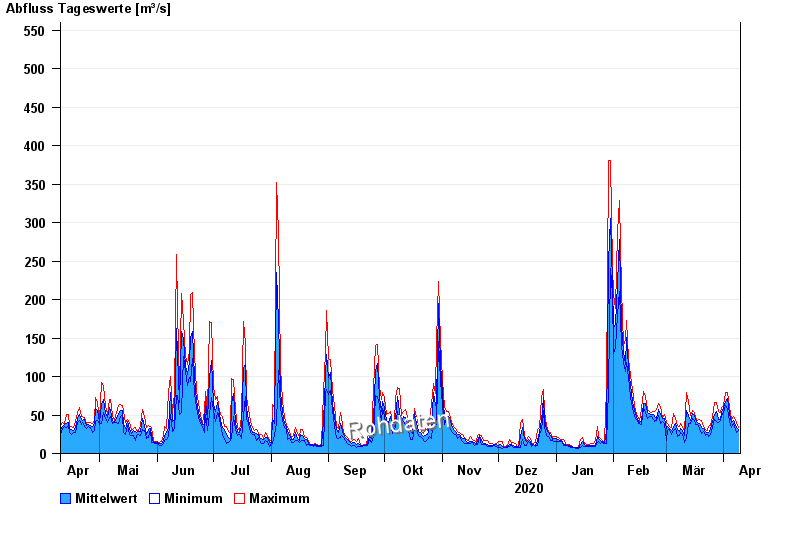
- Chart of year

Chart of year Wiblingen / Iller
Discharge from 10.04.2020 to 09.04.2021
- 23.05.1999 Abfluss: 900 m³/s
- 24.08.2005 Abfluss: 850 m³/s
- 24.11.1944 Abfluss: 791 m³/s
- 31.05.1940 Abfluss: 779 m³/s
- 15.05.1930 Abfluss: 690 m³/s
| Date | Mean value [m³/s] | Maximum [m³/s] | Minimum [m³/s] |
|---|---|---|---|
| 09.04.2021 | 31.3 | 33.7 | 30.1 |
| 08.04.2021 | 34.3 | 40 | 27.1 |
| 07.04.2021 | 40.1 | 44.9 | 34.5 |
| 06.04.2021 | 43.2 | 48.4 | 38.4 |
| 05.04.2021 | 40.5 | 44 | 33.7 |
| 04.04.2021 | 50.4 | 60.5 | 41.6 |
| 03.04.2021 | 71.9 | 79.9 | 58.5 |
© Bayerisches Landesamt für Umwelt 2024