
- Start >
- Rivers >
- Discharge >
- Obere Donau >
- Wiblingen >
- Chart of year

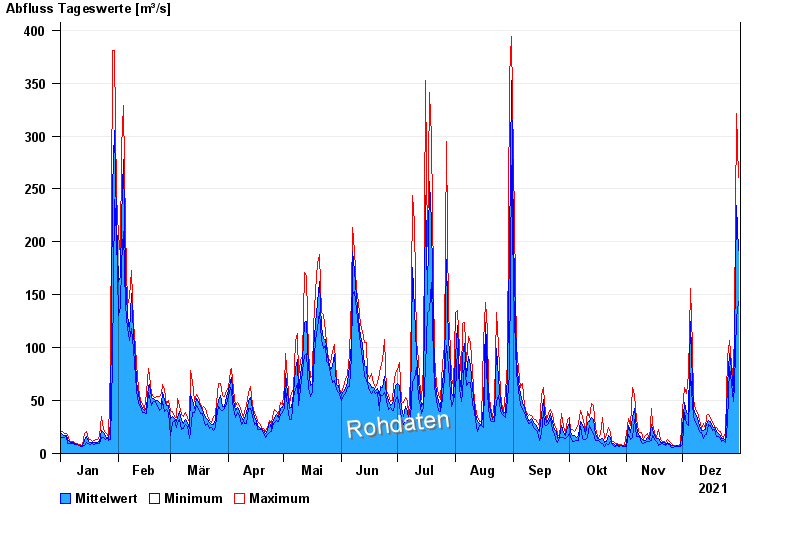
Chart of year Wiblingen / Iller
Discharge from 01.01.2021 to 31.12.2021
| Date | Mean value [m³/s] | Maximum [m³/s] | Minimum [m³/s] |
|---|---|---|---|
| 31.12.2021 | 192 | 261 | 144 |
| 30.12.2021 | 234 | 321 | 128 |
| 29.12.2021 | 104 | 128 | 64.9 |
| 28.12.2021 | 58.5 | 69.1 | 49.4 |
| 27.12.2021 | 79.5 | 83.7 | 65.9 |
| 26.12.2021 | 94.4 | 107 | 82.6 |
| 25.12.2021 | 65.1 | 90.9 | 28.8 |
© Bayerisches Landesamt für Umwelt 2024