
- Start >
- Rivers >
- Discharge >
- Obere Donau >
- Wiblingen >
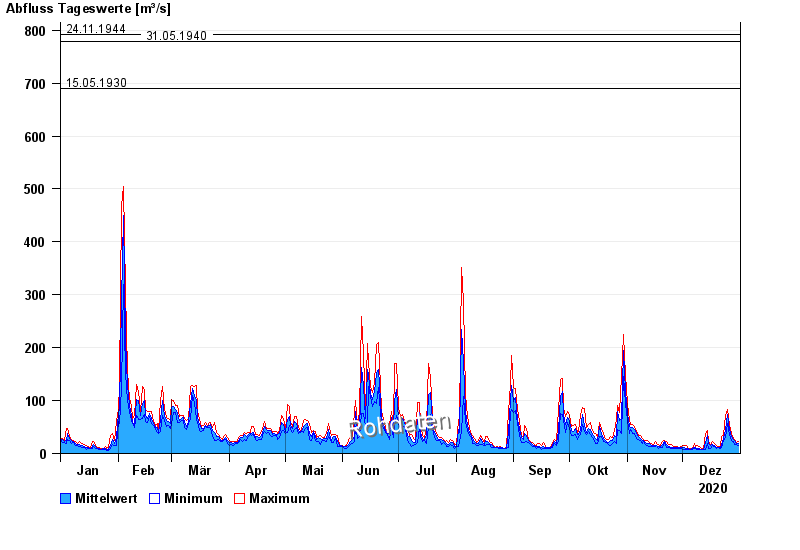
- Chart of year

Chart of year Wiblingen / Iller
Discharge from 01.01.2020 to 31.12.2020
- 23.05.1999 Abfluss: 900 m³/s
- 24.08.2005 Abfluss: 850 m³/s
- 24.11.1944 Abfluss: 791 m³/s
- 31.05.1940 Abfluss: 779 m³/s
- 15.05.1930 Abfluss: 690 m³/s
| Date | Mean value [m³/s] | Maximum [m³/s] | Minimum [m³/s] |
|---|---|---|---|
| 31.12.2020 | 19.3 | 21.9 | 15.3 |
| 30.12.2020 | 18.6 | 21.2 | 16.9 |
| 29.12.2020 | 23.8 | 27.4 | 16.9 |
| 28.12.2020 | 26.9 | 28.8 | 22.6 |
| 27.12.2020 | 31.8 | 36.9 | 23.9 |
| 26.12.2020 | 44.6 | 54 | 35.4 |
| 25.12.2020 | 73.4 | 83.7 | 55.9 |
© Bayerisches Landesamt für Umwelt 2024