
- Start >
- Rivers >
- Discharge >
- Obere Donau >
- Wiblingen >
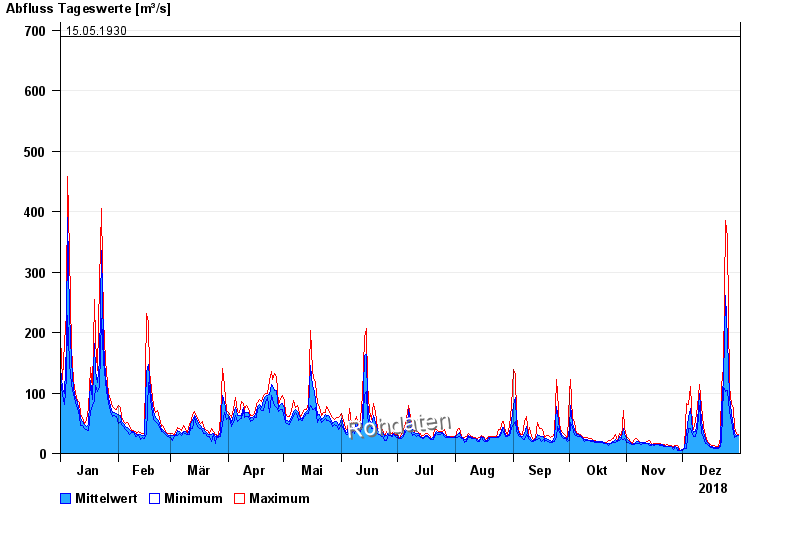
- Chart of year

Chart of year Wiblingen / Iller
Discharge from 01.01.2018 to 31.12.2018
- 23.05.1999 Abfluss: 900 m³/s
- 24.08.2005 Abfluss: 850 m³/s
- 24.11.1944 Abfluss: 791 m³/s
- 31.05.1940 Abfluss: 779 m³/s
- 15.05.1930 Abfluss: 690 m³/s
| Date | Mean value [m³/s] | Maximum [m³/s] | Minimum [m³/s] |
|---|---|---|---|
| 31.12.2018 | 29.8 | 31 | 29 |
| 30.12.2018 | 30 | 32.4 | 28.4 |
| 29.12.2018 | 33.7 | 43.8 | 27.1 |
| 28.12.2018 | 45.1 | 74.8 | 35.3 |
| 27.12.2018 | 65.5 | 81.2 | 53.3 |
| 26.12.2018 | 93.2 | 111 | 69.6 |
| 25.12.2018 | 190 | 358 | 104 |
© Bayerisches Landesamt für Umwelt 2024