
- Start >
- Rivers >
- Discharge >
- Obere Donau >
- Wiblingen >
- Chart of year

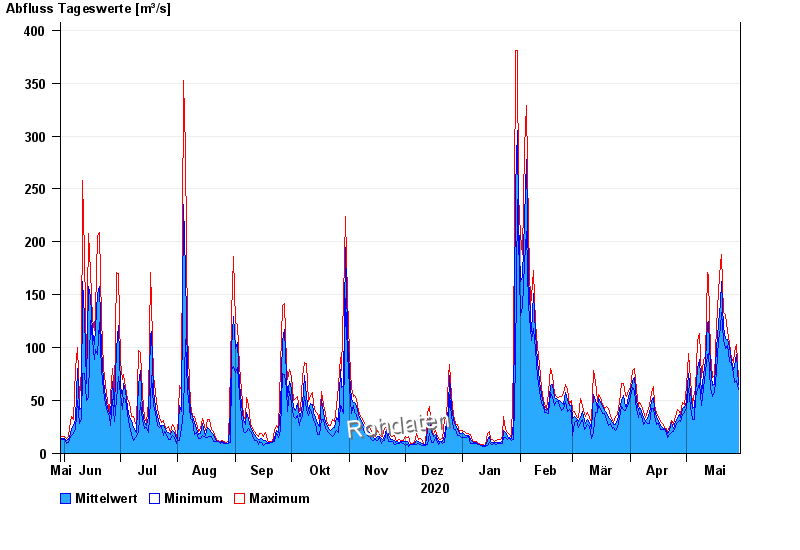
Chart of year Wiblingen / Iller
Discharge from 30.05.2020 to 29.05.2021
| Date | Mean value [m³/s] | Maximum [m³/s] | Minimum [m³/s] |
|---|---|---|---|
| 29.05.2021 | 65.6 | 71 | 60.6 |
| 28.05.2021 | 93.6 | 103 | 68.9 |
| 27.05.2021 | 82.5 | 96.7 | 66.7 |
| 26.05.2021 | 79.3 | 85.9 | 75.5 |
| 25.05.2021 | 86.7 | 89.5 | 84.7 |
| 24.05.2021 | 101 | 104 | 87.1 |
| 23.05.2021 | 108 | 115 | 102 |
© Bayerisches Landesamt für Umwelt 2024