
- Start >
- Rivers >
- Discharge >
- Obere Donau >
- Wiblingen >
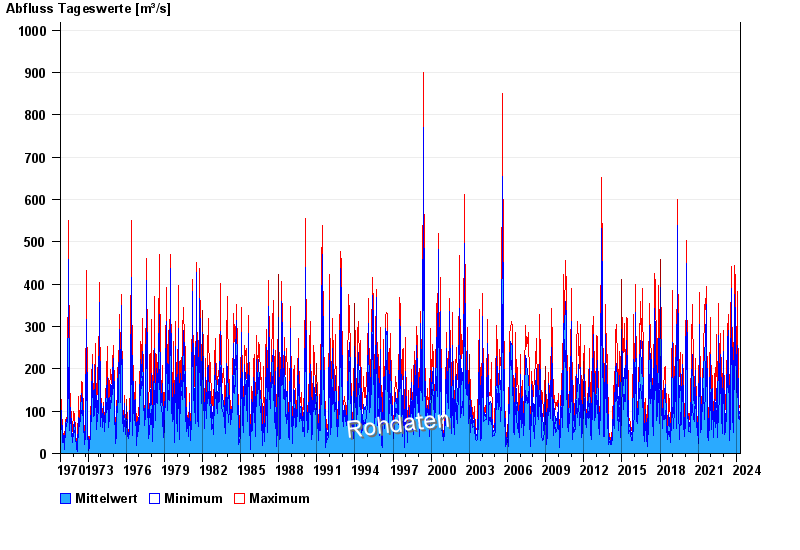
- Chart of total period

Chart of total period Wiblingen / Iller
Discharge from 01.11.1970 to 01.05.2024
| Date | Mean value [m³/s] | Maximum [m³/s] | Minimum [m³/s] |
|---|---|---|---|
| 01.05.2024 | 105 | 113 | 96.5 |
| 30.04.2024 | 105 | 118 | 93 |
| 29.04.2024 | 102 | 112 | 81 |
| 28.04.2024 | 83.7 | 113 | 57.6 |
| 27.04.2024 | 63.3 | 70.8 | 52.8 |
| 26.04.2024 | 58.7 | 61.4 | 51.9 |
| 25.04.2024 | 60.3 | 64.5 | 53.8 |
© Bayerisches Landesamt für Umwelt 2024