
- Start >
- Rivers >
- Discharge >
- Obere Donau >
- Treuchtlingen >
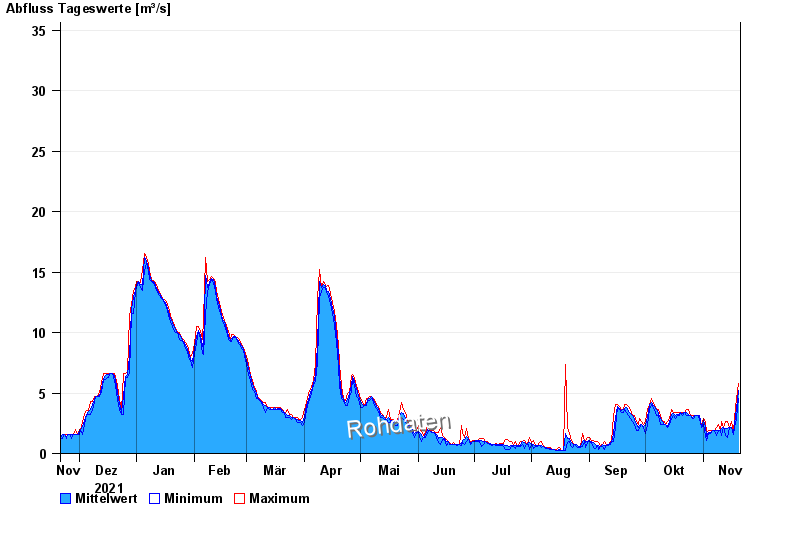
- Chart of year

Chart of year Treuchtlingen / Altmühl
Discharge from 21.11.2021 to 20.11.2022
- HQ1 45 m³/s
- HQ2 63 m³/s
- HQ5 85 m³/s
- HQ10 110 m³/s
- HQ20 135 m³/s
- HQ50 170 m³/s
- HQ100 200 m³/s
| Date | Mean value [m³/s] | Maximum [m³/s] | Minimum [m³/s] |
|---|---|---|---|
| 20.11.2022 | 5.2 | 5.79 | 4.51 |
| 19.11.2022 | 3.71 | 4.51 | 2.88 |
| 18.11.2022 | 2.51 | 2.88 | 2.12 |
| 17.11.2022 | 1.54 | 1.72 | 1.53 |
| 16.11.2022 | 2.16 | 2.62 | 2.12 |
| 15.11.2022 | 2.12 | 2.12 | 2.12 |
| 14.11.2022 | 2.08 | 2.62 | 1.29 |
© Bayerisches Landesamt für Umwelt 2024