
- Start >
- Rivers >
- Discharge >
- Obere Donau >
- Treuchtlingen >
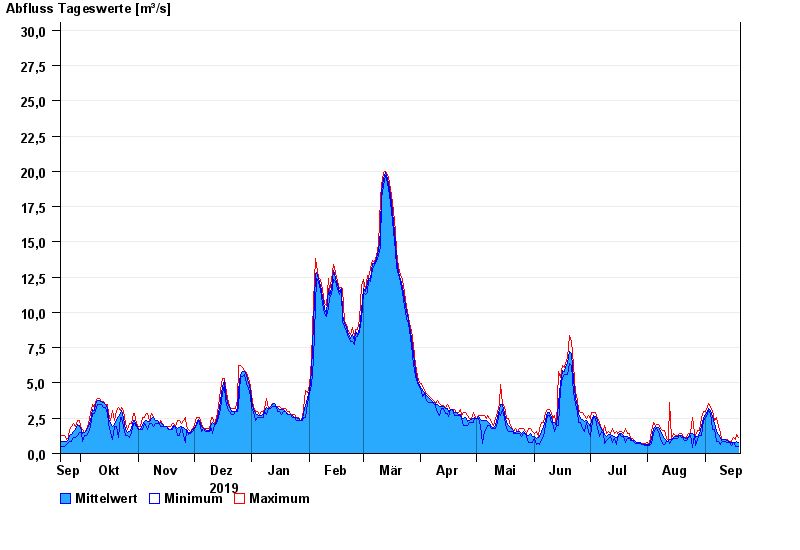
- Chart of year

Chart of year Treuchtlingen / Altmühl
Discharge from 20.09.2019 to 19.09.2020
- 05.03.1956 Abfluss: 183 m³/s
- 21.03.1942 Abfluss: 168 m³/s
- 18.03.1988 Abfluss: 158 m³/s
- 24.02.1970 Abfluss: 145 m³/s
- 07.02.1945 Abfluss: 129 m³/s
| Date | Mean value [m³/s] | Maximum [m³/s] | Minimum [m³/s] |
|---|---|---|---|
| 19.09.2020 | 0.765 | 1.15 | 0.468 |
| 18.09.2020 | 0.816 | 1.32 | 0.531 |
| 17.09.2020 | 0.761 | 0.996 | 0.53 |
| 16.09.2020 | 0.804 | 1.15 | 0.77 |
| 15.09.2020 | 0.754 | 0.868 | 0.599 |
| 14.09.2020 | 0.849 | 0.868 | 0.768 |
| 13.09.2020 | 0.887 | 0.99 | 0.767 |
© Bayerisches Landesamt für Umwelt 2024