
- Start >
- Rivers >
- Discharge >
- Obere Donau >
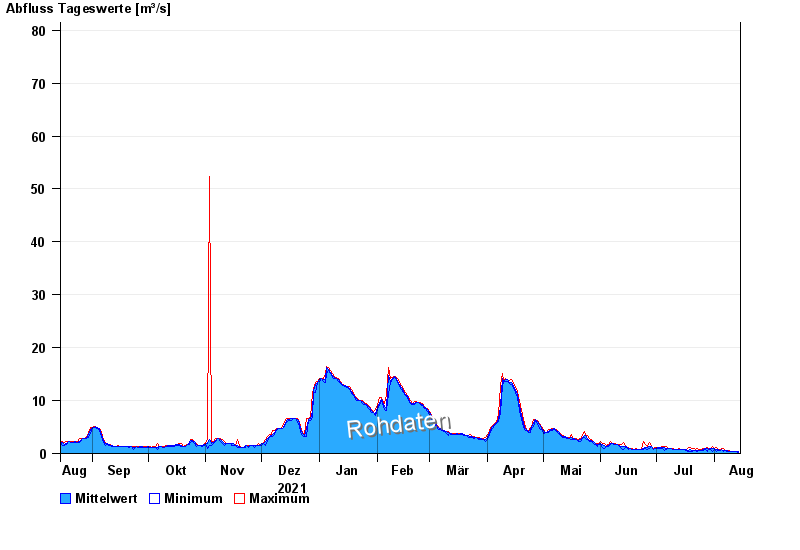
- Treuchtlingen >
- Chart of year

Chart of year Treuchtlingen / Altmühl
Discharge from 15.08.2021 to 14.08.2022
- 05.03.1956 Abfluss: 183 m³/s
- 21.03.1942 Abfluss: 168 m³/s
- 18.03.1988 Abfluss: 158 m³/s
- 24.02.1970 Abfluss: 145 m³/s
- 07.02.1945 Abfluss: 129 m³/s
| Date | Mean value [m³/s] | Maximum [m³/s] | Minimum [m³/s] |
|---|---|---|---|
| 14.08.2022 | 0.288 | 0.303 | 0.257 |
| 13.08.2022 | 0.308 | 0.352 | 0.303 |
| 12.08.2022 | 0.337 | 0.352 | 0.303 |
| 11.08.2022 | 0.409 | 0.463 | 0.352 |
| 10.08.2022 | 0.442 | 0.463 | 0.405 |
| 09.08.2022 | 0.461 | 0.527 | 0.405 |
| 08.08.2022 | 0.537 | 0.598 | 0.463 |
© Bayerisches Landesamt für Umwelt 2024