
- Start >
- Rivers >
- Discharge >
- Obere Donau >
- Treuchtlingen >
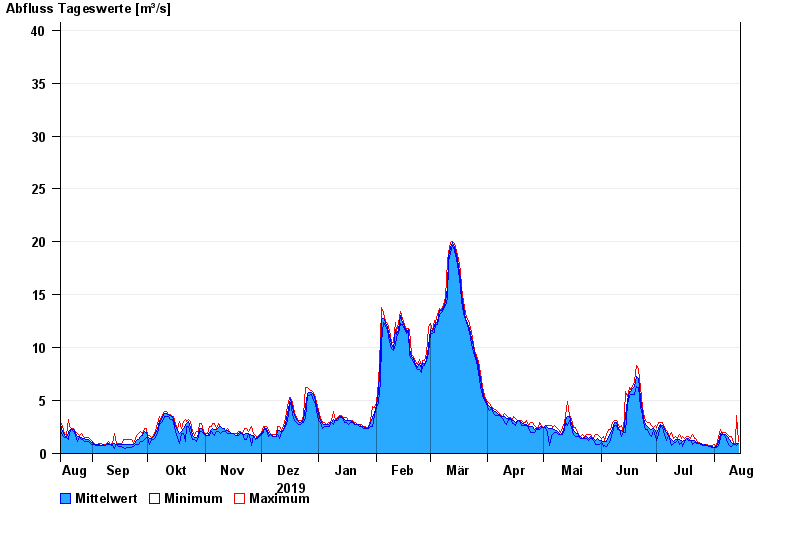
- Chart of year

Chart of year Treuchtlingen / Altmühl
Discharge from 15.08.2019 to 14.08.2020
- HQ1 45 m³/s
- HQ2 63 m³/s
- HQ5 85 m³/s
- HQ10 110 m³/s
- HQ20 135 m³/s
- HQ50 170 m³/s
- HQ100 200 m³/s
| Date | Mean value [m³/s] | Maximum [m³/s] | Minimum [m³/s] |
|---|---|---|---|
| 14.08.2020 | 0.971 | 1.09 | 0.941 |
| 13.08.2020 | 0.987 | 3.61 | 0.727 |
| 12.08.2020 | 0.824 | 0.938 | 0.82 |
| 11.08.2020 | 0.939 | 1.08 | 0.819 |
| 10.08.2020 | 1.07 | 1.6 | 0.639 |
| 09.08.2020 | 1.3 | 1.6 | 0.723 |
| 08.08.2020 | 1.57 | 1.8 | 1.08 |
© Bayerisches Landesamt für Umwelt 2024