
- Start >
- Rivers >
- Discharge >
- Obere Donau >
- Treuchtlingen >
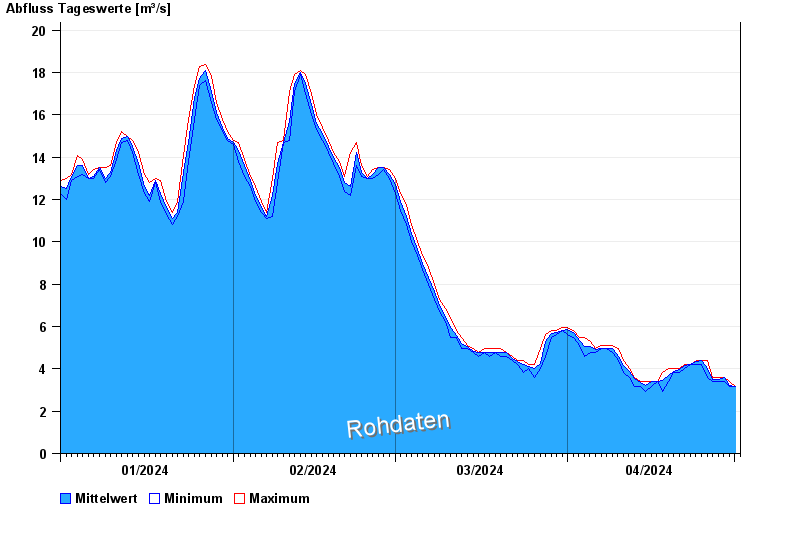
- Chart of year

Chart of year Treuchtlingen / Altmühl
Discharge from 01.01.2024 to 01.05.2024
| Date | Mean value [m³/s] | Maximum [m³/s] | Minimum [m³/s] |
|---|---|---|---|
| 01.05.2024 | 3.16 | 3.16 | 3.16 |
| 30.04.2024 | 3.19 | 3.39 | 3.16 |
| 29.04.2024 | 3.58 | 3.61 | 3.39 |
| 28.04.2024 | 3.5 | 3.61 | 3.39 |
| 27.04.2024 | 3.48 | 3.61 | 3.39 |
| 26.04.2024 | 4.02 | 4.4 | 3.61 |
| 25.04.2024 | 4.4 | 4.4 | 4.21 |
© Bayerisches Landesamt für Umwelt 2024