
- Start >
- Rivers >
- Discharge >
- Obere Donau >
- Treuchtlingen >
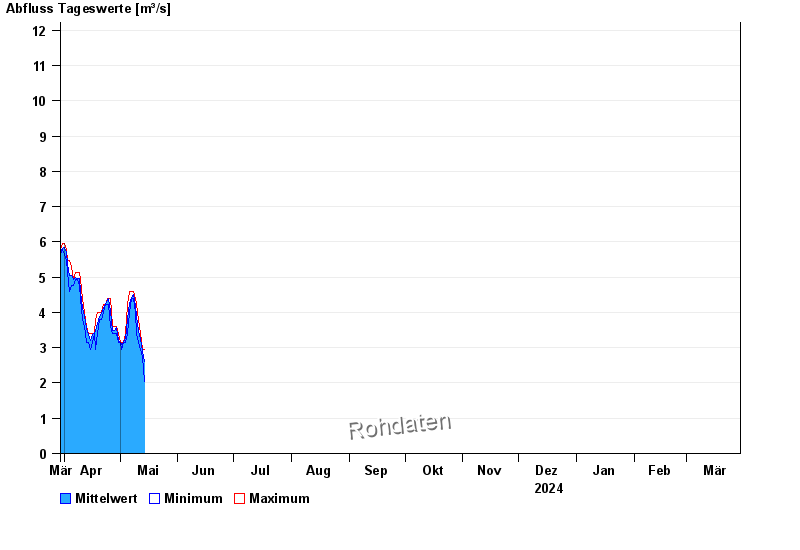
- Chart of year

Chart of year Treuchtlingen / Altmühl
Discharge from 30.03.2024 to 29.03.2025
- HQ1 45 m³/s
- HQ2 63 m³/s
- HQ5 85 m³/s
- HQ10 110 m³/s
- HQ20 135 m³/s
- HQ50 170 m³/s
- HQ100 200 m³/s
| Date | Mean value [m³/s] | Maximum [m³/s] | Minimum [m³/s] |
|---|---|---|---|
| 29.04.2024 | 3.61 | 3.61 | 3.39 |
| 28.04.2024 | 3.5 | 3.61 | 3.39 |
| 27.04.2024 | 3.48 | 3.61 | 3.39 |
| 26.04.2024 | 4.02 | 4.4 | 3.61 |
| 25.04.2024 | 4.4 | 4.4 | 4.21 |
| 24.04.2024 | 4.34 | 4.4 | 4.21 |
| 23.04.2024 | 4.21 | 4.21 | 4.21 |
© Bayerisches Landesamt für Umwelt 2024