
- Start >
- Rivers >
- Discharge >
- Obere Donau >
- Treuchtlingen >
- Chart of year

Chart of year Treuchtlingen / Altmühl
Discharge from 17.12.2018 to 16.12.2019
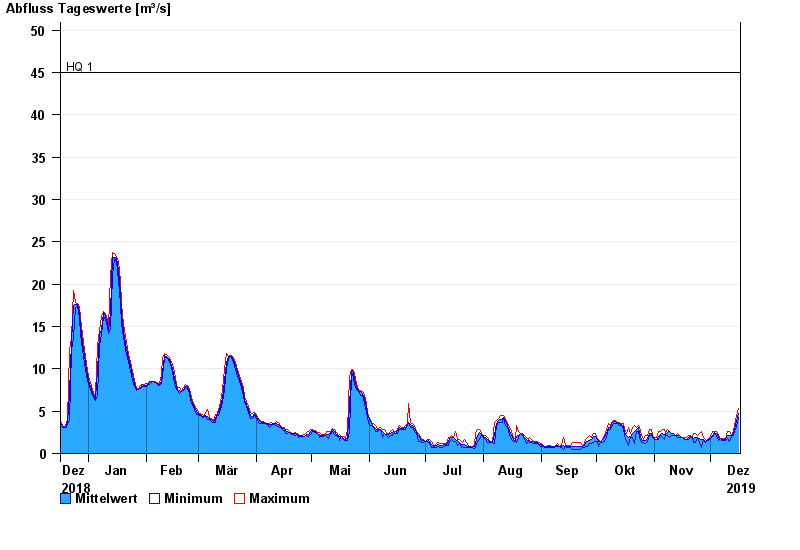
- HQ1 45 m³/s
- HQ2 63 m³/s
- HQ5 85 m³/s
- HQ10 110 m³/s
- HQ20 135 m³/s
- HQ50 170 m³/s
- HQ100 200 m³/s
| Date | Mean value [m³/s] | Maximum [m³/s] | Minimum [m³/s] |
|---|---|---|---|
| 16.12.2019 | 4.76 | 5.3 | 4.27 |
| 15.12.2019 | 3.75 | 4.45 | 3.16 |
| 14.12.2019 | 2.85 | 3.36 | 2.56 |
| 13.12.2019 | 2.3 | 2.56 | 2.16 |
| 12.12.2019 | 2.09 | 2.16 | 1.97 |
| 11.12.2019 | 2.17 | 2.56 | 1.41 |
| 10.12.2019 | 2.15 | 2.56 | 1.78 |
© Bayerisches Landesamt für Umwelt 2024