
- Start >
- Rivers >
- Discharge >
- Obere Donau >
- Treuchtlingen >
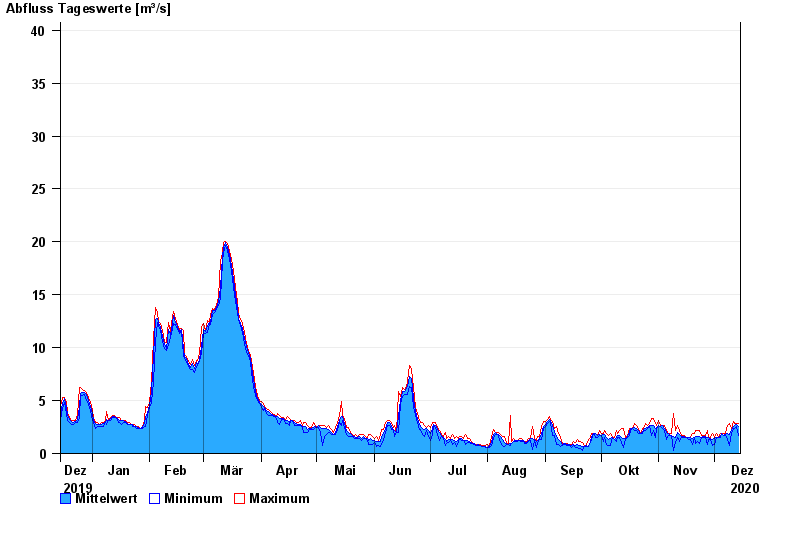
- Chart of year

Chart of year Treuchtlingen / Altmühl
Discharge from 15.12.2019 to 14.12.2020
- HQ1 45 m³/s
- HQ2 63 m³/s
- HQ5 85 m³/s
- HQ10 110 m³/s
- HQ20 135 m³/s
- HQ50 170 m³/s
- HQ100 200 m³/s
| Date | Mean value [m³/s] | Maximum [m³/s] | Minimum [m³/s] |
|---|---|---|---|
| 14.12.2020 | 2.51 | 2.82 | 1.68 |
| 13.12.2020 | 2.76 | 2.82 | 2.59 |
| 12.12.2020 | 2.67 | 2.82 | 2.36 |
| 11.12.2020 | 2.52 | 3.05 | 2.36 |
| 10.12.2020 | 2.14 | 2.36 | 1.9 |
| 09.12.2020 | 1.77 | 2.83 | 0.765 |
| 08.12.2020 | 1.87 | 2.6 | 1.31 |
© Bayerisches Landesamt für Umwelt 2024