
- Start >
- Rivers >
- Discharge >
- Obere Donau >
- Treuchtlingen >
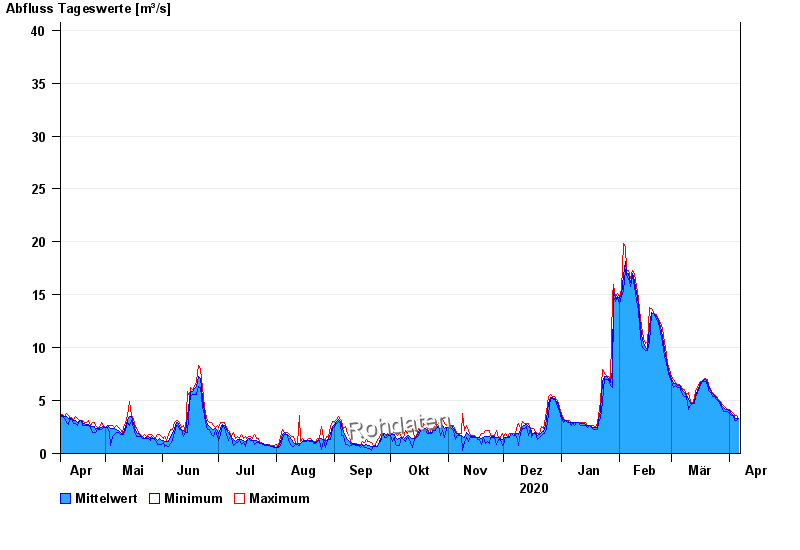
- Chart of year

Chart of year Treuchtlingen / Altmühl
Discharge from 07.04.2020 to 06.04.2021
- HQ1 45 m³/s
- HQ2 63 m³/s
- HQ5 85 m³/s
- HQ10 110 m³/s
- HQ20 135 m³/s
- HQ50 170 m³/s
- HQ100 200 m³/s
| Date | Mean value [m³/s] | Maximum [m³/s] | Minimum [m³/s] |
|---|---|---|---|
| 06.04.2021 | 3.35 | 3.35 | 3.35 |
| 05.04.2021 | 3.35 | 3.57 | 3.12 |
| 04.04.2021 | 3.44 | 3.57 | 3.12 |
| 03.04.2021 | 3.62 | 3.78 | 3.57 |
| 02.04.2021 | 3.81 | 3.98 | 3.57 |
| 01.04.2021 | 4.05 | 4.17 | 3.78 |
| 31.03.2021 | 4.14 | 4.17 | 3.98 |
© Bayerisches Landesamt für Umwelt 2024