
- Start >
- Rivers >
- Discharge >
- Obere Donau >
- Thann >
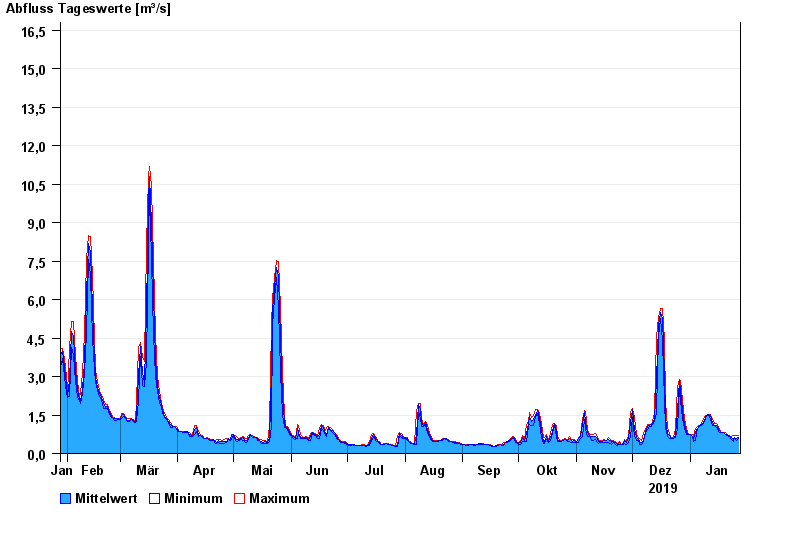
- Chart of year

Chart of year Thann / Altmühl
Discharge from 28.01.2019 to 27.01.2020
- 21.12.1993 Abfluss: 103 m³/s
- 01.06.2013 Abfluss: 98,9 m³/s
- 08.01.2011 Abfluss: 95,4 m³/s
- 29.10.1998 Abfluss: 90,8 m³/s
- 17.06.2007 Abfluss: 87,9 m³/s
| Date | Mean value [m³/s] | Maximum [m³/s] | Minimum [m³/s] |
|---|---|---|---|
| 27.01.2020 | 0.623 | 0.7 | 0.567 |
| 26.01.2020 | 0.589 | 0.702 | 0.5 |
| 25.01.2020 | 0.642 | 0.685 | 0.607 |
| 24.01.2020 | 0.558 | 0.686 | 0.486 |
| 23.01.2020 | 0.642 | 0.67 | 0.538 |
| 22.01.2020 | 0.69 | 0.712 | 0.67 |
| 21.01.2020 | 0.731 | 0.734 | 0.712 |
© Bayerisches Landesamt für Umwelt 2024