
- Start >
- Rivers >
- Discharge >
- Obere Donau >
- Thann >
- Chart of year

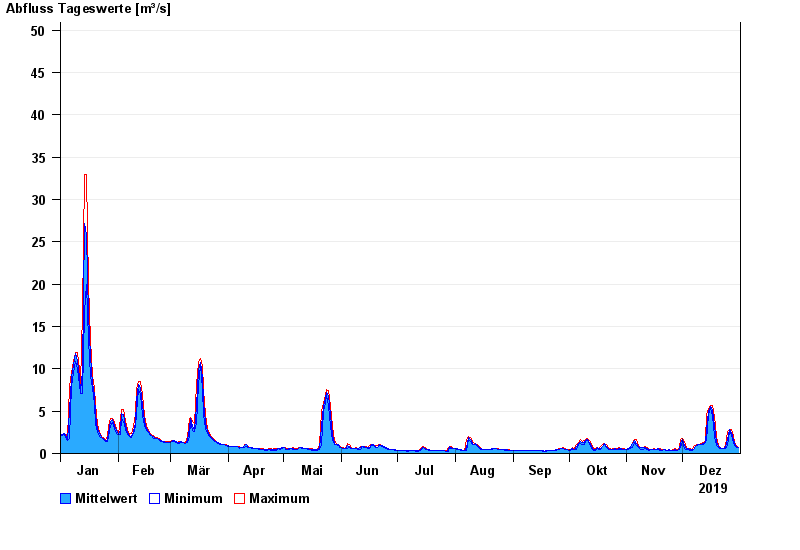
Chart of year Thann / Altmühl
Discharge from 01.01.2019 to 31.12.2019
- 21.12.1993 Abfluss: 103 m³/s
- 01.06.2013 Abfluss: 98,9 m³/s
- 08.01.2011 Abfluss: 95,4 m³/s
- 29.10.1998 Abfluss: 90,8 m³/s
- 17.06.2007 Abfluss: 87,9 m³/s
| Date | Mean value [m³/s] | Maximum [m³/s] | Minimum [m³/s] |
|---|---|---|---|
| 31.12.2019 | 0.739 | 0.752 | 0.723 |
| 30.12.2019 | 0.834 | 0.972 | 0.737 |
| 29.12.2019 | 1.14 | 1.35 | 0.97 |
| 28.12.2019 | 1.69 | 2.08 | 1.35 |
| 27.12.2019 | 2.49 | 2.85 | 2.08 |
| 26.12.2019 | 2.83 | 2.89 | 2.6 |
| 25.12.2019 | 1.66 | 2.6 | 0.96 |
© Bayerisches Landesamt für Umwelt 2024