
- Start >
- Rivers >
- Discharge >
- Obere Donau >
- Schwabach >
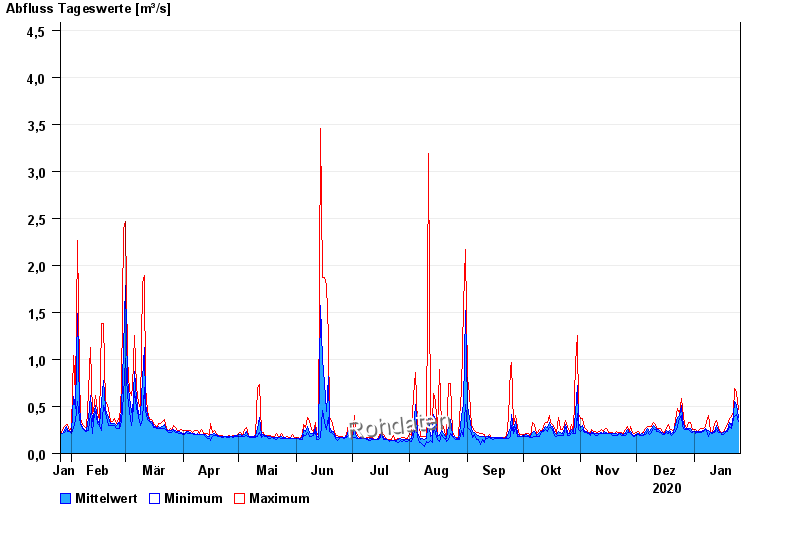
- Chart of year

Chart of year Schwabach / Schwabach
Discharge from 26.01.2020 to 25.01.2021
- 08.01.2011 Abfluss: 8,17 m³/s
- 09.03.2006 Abfluss: 8,11 m³/s
- 02.03.1987 Abfluss: 7,37 m³/s
- 29.10.1998 Abfluss: 7,36 m³/s
- 16.03.2005 Abfluss: 7,26 m³/s
| Date | Mean value [m³/s] | Maximum [m³/s] | Minimum [m³/s] |
|---|---|---|---|
| 25.01.2021 | 0.378 | 0.472 | 0.343 |
| 24.01.2021 | 0.514 | 0.647 | 0.416 |
| 23.01.2021 | 0.55 | 0.691 | 0.392 |
| 22.01.2021 | 0.4 | 0.446 | 0.368 |
| 21.01.2021 | 0.301 | 0.393 | 0.266 |
| 20.01.2021 | 0.326 | 0.37 | 0.284 |
| 19.01.2021 | 0.25 | 0.304 | 0.233 |
© Bayerisches Landesamt für Umwelt 2024