
- Start >
- Rivers >
- Discharge >
- Obere Donau >
- Schwabach >
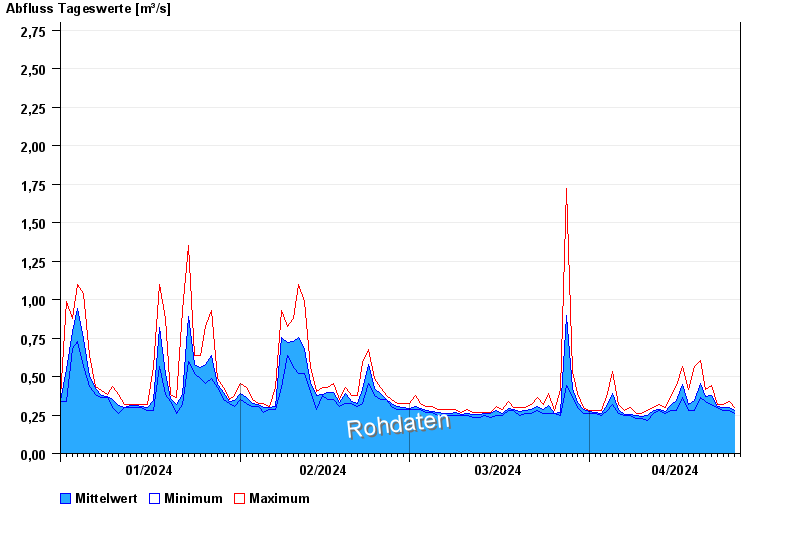
- Chart of year

Chart of year Schwabach / Schwabach
Discharge from 01.01.2024 to 26.04.2024
- 08.01.2011 Abfluss: 8,17 m³/s
- 09.03.2006 Abfluss: 8,11 m³/s
- 02.03.1987 Abfluss: 7,37 m³/s
- 29.10.1998 Abfluss: 7,36 m³/s
- 16.03.2005 Abfluss: 7,26 m³/s
| Date | Mean value [m³/s] | Maximum [m³/s] | Minimum [m³/s] |
|---|---|---|---|
| 26.04.2024 | 0.281 | 0.298 | 0.261 |
| 25.04.2024 | 0.299 | 0.34 | 0.279 |
| 24.04.2024 | 0.3 | 0.319 | 0.279 |
| 23.04.2024 | 0.303 | 0.319 | 0.298 |
| 22.04.2024 | 0.38 | 0.44 | 0.319 |
| 21.04.2024 | 0.368 | 0.413 | 0.34 |
| 20.04.2024 | 0.453 | 0.602 | 0.363 |
© Bayerisches Landesamt für Umwelt 2024