
- Start >
- Rivers >
- Discharge >
- Obere Donau >
- Schambach >
- Chart of year

Chart of year Schambach / Schambach
Discharge from 01.01.2023 to 31.12.2023
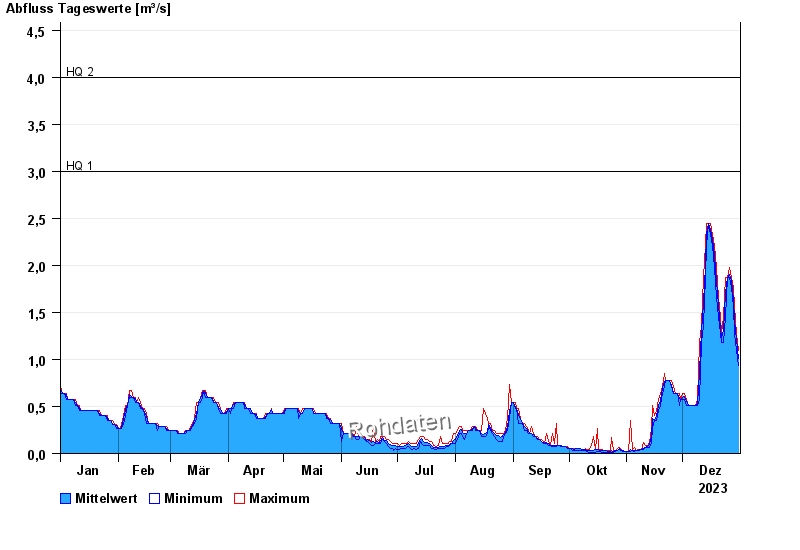
- HQ1 3 m³/s
- HQ2 4 m³/s
- HQ5 5 m³/s
- HQ10 7 m³/s
- HQ20 9 m³/s
| Date | Mean value [m³/s] | Maximum [m³/s] | Minimum [m³/s] |
|---|---|---|---|
| 31.12.2023 | 1.01 | 1.1 | 0.933 |
| 30.12.2023 | 1.21 | 1.28 | 1.1 |
| 29.12.2023 | 1.41 | 1.56 | 1.28 |
| 28.12.2023 | 1.63 | 1.76 | 1.56 |
| 27.12.2023 | 1.84 | 1.87 | 1.76 |
| 26.12.2023 | 1.9 | 1.98 | 1.87 |
| 25.12.2023 | 1.87 | 1.87 | 1.87 |
© Bayerisches Landesamt für Umwelt 2024