
- Start >
- Rivers >
- Discharge >
- Obere Donau >
- Roth Kläranlage >
- Chart of year

Chart of year Roth Kläranlage / Rednitz
Discharge from 24.10.2020 to 23.10.2021
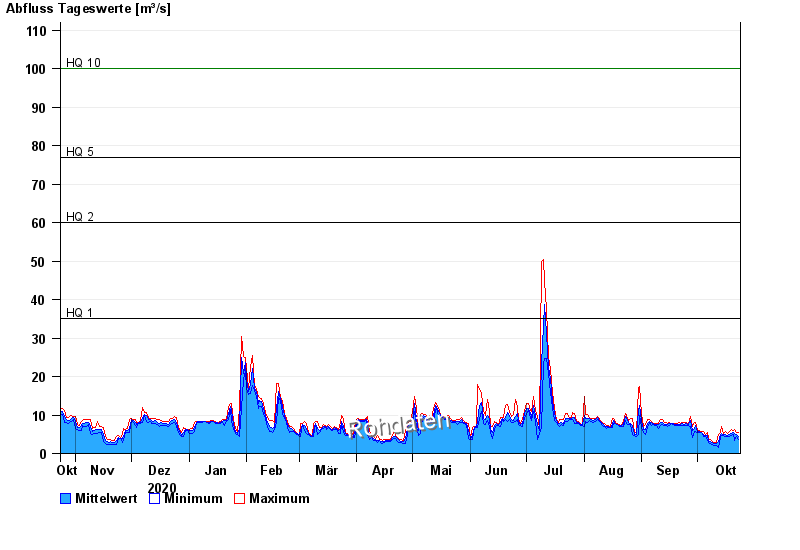
- HQ1 35 m³/s
- HQ2 60 m³/s
- HQ5 77 m³/s
- HQ10 100 m³/s
- HQ20 130 m³/s
- HQ50 170 m³/s
- HQ100 200 m³/s
| Date | Mean value [m³/s] | Maximum [m³/s] | Minimum [m³/s] |
|---|---|---|---|
| 23.10.2021 | 4.49 | 5.39 | 3.73 |
| 22.10.2021 | 4.93 | 5.39 | 4.4 |
| 21.10.2021 | 5.18 | 6.29 | 3.47 |
| 20.10.2021 | 5.4 | 5.98 | 4.95 |
| 19.10.2021 | 5.24 | 6.13 | 4.67 |
| 18.10.2021 | 4.82 | 5.68 | 4.53 |
| 17.10.2021 | 4.76 | 5.23 | 4.39 |
© Bayerisches Landesamt für Umwelt 2024