
- Start >
- Rivers >
- Discharge >
- Obere Donau >
- Roth Kläranlage >
- Chart of year

Chart of year Roth Kläranlage / Rednitz
Discharge from 22.09.2019 to 21.09.2020
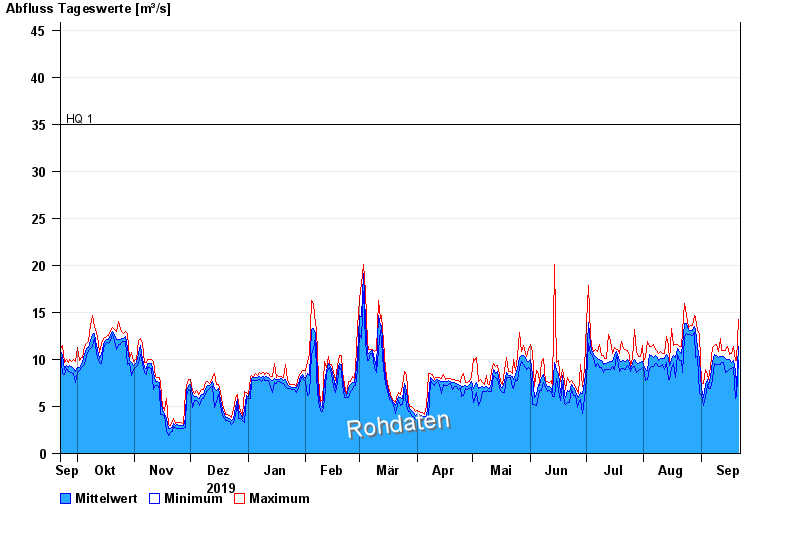
- HQ1 35 m³/s
- HQ2 60 m³/s
- HQ5 77 m³/s
- HQ10 100 m³/s
- HQ20 130 m³/s
- HQ50 170 m³/s
- HQ100 200 m³/s
| Date | Mean value [m³/s] | Maximum [m³/s] | Minimum [m³/s] |
|---|---|---|---|
| 21.09.2020 | 11.4 | 14.2 | 9.93 |
| 20.09.2020 | 7.08 | 9.93 | 6.14 |
| 19.09.2020 | 8.84 | 9.91 | 5.83 |
| 18.09.2020 | 9.86 | 11.4 | 9.09 |
| 17.09.2020 | 9.66 | 10.6 | 9.07 |
| 16.09.2020 | 9.95 | 10.5 | 8.91 |
| 15.09.2020 | 9.94 | 11.4 | 8.74 |
© Bayerisches Landesamt für Umwelt 2024