
- Start >
- Rivers >
- Discharge >
- Obere Donau >
- Roth Kläranlage >
- Chart of year

Chart of year Roth Kläranlage / Rednitz
Discharge from 20.11.2019 to 19.11.2020
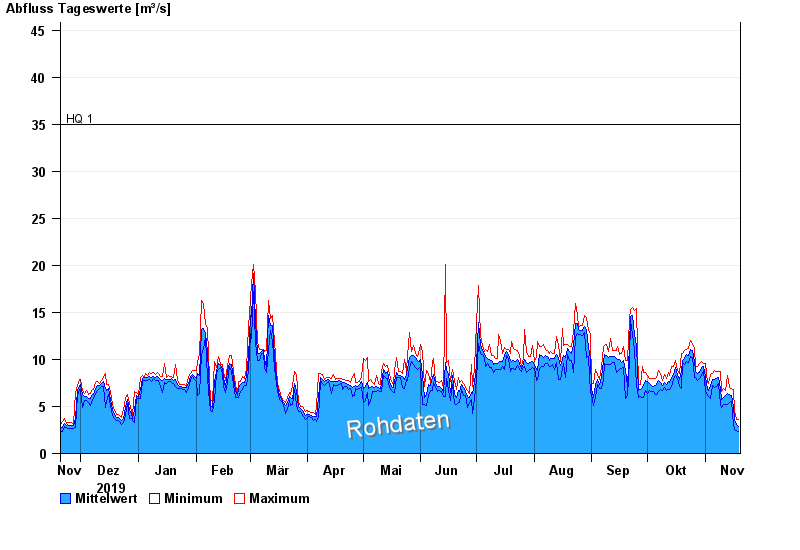
- HQ1 35 m³/s
- HQ2 60 m³/s
- HQ5 77 m³/s
- HQ10 100 m³/s
- HQ20 130 m³/s
- HQ50 170 m³/s
- HQ100 200 m³/s
| Date | Mean value [m³/s] | Maximum [m³/s] | Minimum [m³/s] |
|---|---|---|---|
| 19.11.2020 | 2.92 | 3.65 | 2.31 |
| 18.11.2020 | 3.12 | 3.63 | 2.41 |
| 17.11.2020 | 3.48 | 4.42 | 2.52 |
| 16.11.2020 | 5.03 | 6.77 | 3.11 |
| 15.11.2020 | 6.2 | 6.91 | 5.55 |
| 14.11.2020 | 6.27 | 7.06 | 5.39 |
| 13.11.2020 | 6.35 | 8.3 | 5.23 |
© Bayerisches Landesamt für Umwelt 2024