
- Start >
- Rivers >
- Discharge >
- Obere Donau >
- Roth Kläranlage >
- Chart of year

Chart of year Roth Kläranlage / Rednitz
Discharge from 10.08.2020 to 09.08.2021
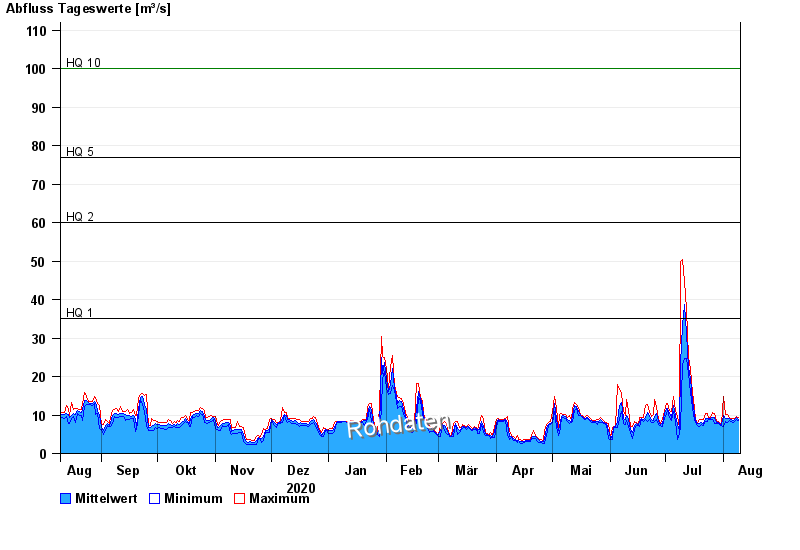
- HQ1 35 m³/s
- HQ2 60 m³/s
- HQ5 77 m³/s
- HQ10 100 m³/s
- HQ20 130 m³/s
- HQ50 170 m³/s
- HQ100 200 m³/s
| Date | Mean value [m³/s] | Maximum [m³/s] | Minimum [m³/s] |
|---|---|---|---|
| 09.08.2021 | 8.94 | 9.27 | 8.46 |
| 08.08.2021 | 9.3 | 9.6 | 8.95 |
| 07.08.2021 | 8.83 | 9.12 | 8.32 |
| 06.08.2021 | 8.64 | 9.12 | 8.17 |
| 05.08.2021 | 8.72 | 8.97 | 8.33 |
| 04.08.2021 | 9.07 | 9.46 | 8.65 |
| 03.08.2021 | 9.03 | 10.1 | 8.03 |
© Bayerisches Landesamt für Umwelt 2024