
- Start >
- Rivers >
- Discharge >
- Obere Donau >
- Roth Kläranlage >
- Chart of year

Chart of year Roth Kläranlage / Rednitz
Discharge from 01.01.2018 to 31.12.2018
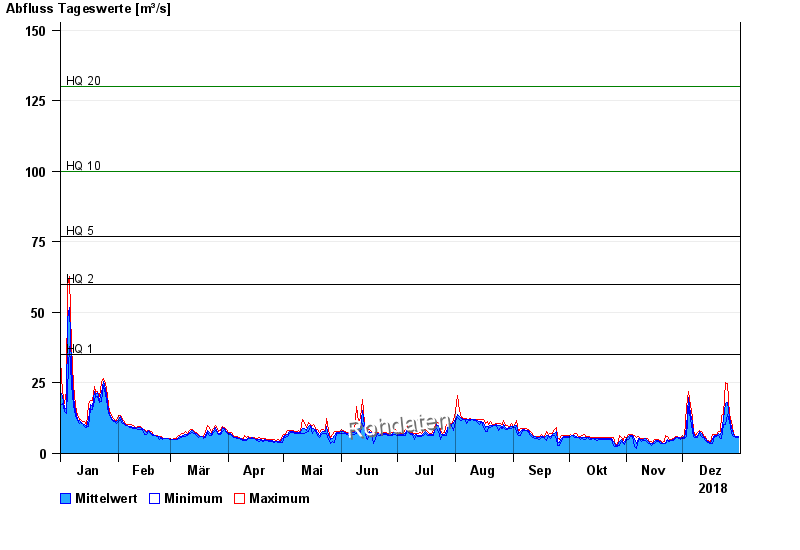
- HQ1 35 m³/s
- HQ2 60 m³/s
- HQ5 77 m³/s
- HQ10 100 m³/s
- HQ20 130 m³/s
- HQ50 170 m³/s
- HQ100 200 m³/s
| Date | Mean value [m³/s] | Maximum [m³/s] | Minimum [m³/s] |
|---|---|---|---|
| 31.12.2018 | 5.94 | 6.12 | 5.81 |
| 30.12.2018 | 5.98 | 6 | 5.84 |
| 29.12.2018 | 6.06 | 6.33 | 5.86 |
| 28.12.2018 | 6.93 | 7.59 | 5.88 |
| 27.12.2018 | 9.04 | 11.3 | 7.12 |
| 26.12.2018 | 12.7 | 13.8 | 11.3 |
| 25.12.2018 | 18 | 24.9 | 13.8 |
© Bayerisches Landesamt für Umwelt 2024