
- Start >
- Rivers >
- Discharge >
- Obere Donau >
- Roth Kläranlage >
- Chart of year

Chart of year Roth Kläranlage / Rednitz
Discharge from 01.01.2024 to 27.04.2024
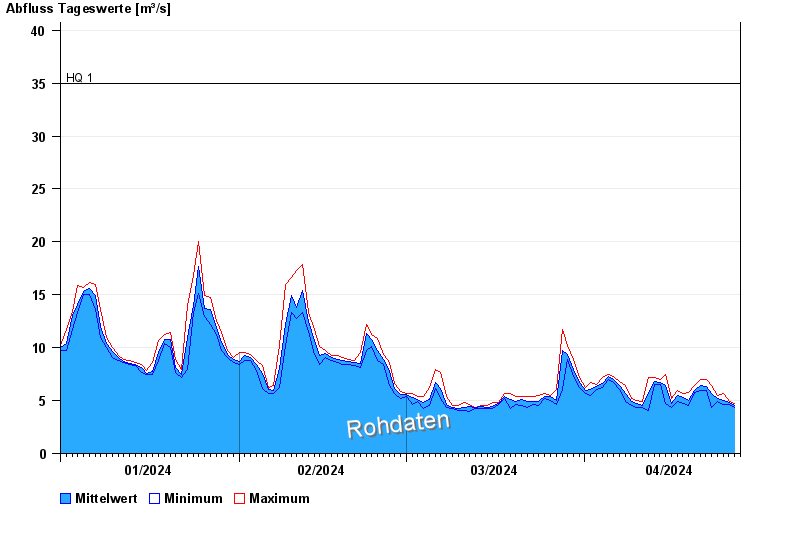
- HQ1 35 m³/s
- HQ2 60 m³/s
- HQ5 77 m³/s
- HQ10 100 m³/s
- HQ20 130 m³/s
- HQ50 170 m³/s
- HQ100 200 m³/s
| Date | Mean value [m³/s] | Maximum [m³/s] | Minimum [m³/s] |
|---|---|---|---|
| 27.04.2024 | 4.63 | 4.63 | 4.63 |
| 26.04.2024 | 4.81 | 4.91 | 4.63 |
| 25.04.2024 | 4.97 | 5.63 | 4.63 |
| 24.04.2024 | 5.18 | 5.48 | 4.91 |
| 23.04.2024 | 5.67 | 6.38 | 4.35 |
| 22.04.2024 | 6.35 | 7 | 5.93 |
| 21.04.2024 | 6.45 | 7 | 5.93 |
© Bayerisches Landesamt für Umwelt 2024