
- Start >
- Rivers >
- Discharge >
- Obere Donau >
- Roth >
- Chart of year

Chart of year Roth / Roth
Discharge from 15.08.2020 to 14.08.2021
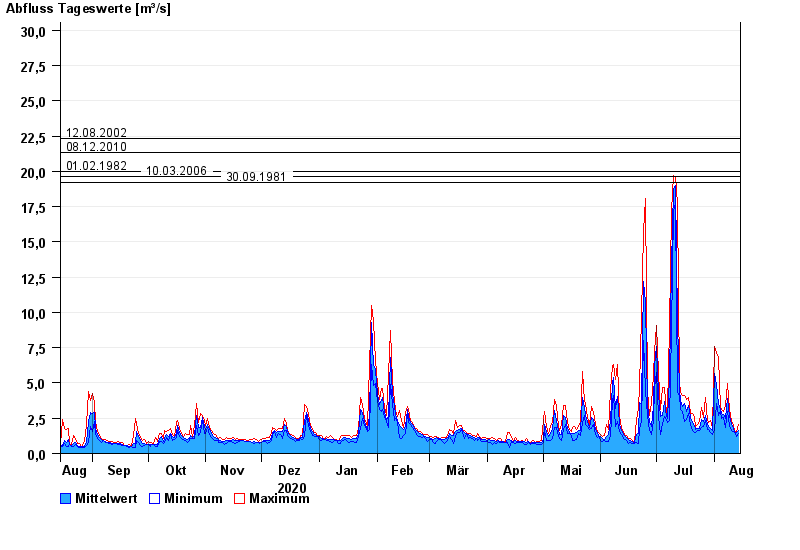
- 12.08.2002 Abfluss: 22,3 m³/s
- 08.12.2010 Abfluss: 21,3 m³/s
- 01.02.1982 Abfluss: 20 m³/s
- 10.03.2006 Abfluss: 19,6 m³/s
- 30.09.1981 Abfluss: 19,2 m³/s
| Date | Mean value [m³/s] | Maximum [m³/s] | Minimum [m³/s] |
|---|---|---|---|
| 14.08.2021 | 1.65 | 2.08 | 1.43 |
| 13.08.2021 | 1.46 | 1.53 | 1.24 |
| 12.08.2021 | 1.59 | 1.63 | 1.53 |
| 11.08.2021 | 1.75 | 1.97 | 1.53 |
| 10.08.2021 | 2.07 | 2.33 | 1.63 |
| 09.08.2021 | 2.61 | 3.13 | 1.97 |
| 08.08.2021 | 3.87 | 4.99 | 2.99 |
© Bayerisches Landesamt für Umwelt 2024