
- Start >
- Rivers >
- Discharge >
- Obere Donau >
- Roth >
- Chart of year

Chart of year Roth / Roth
Discharge from 01.01.2020 to 31.12.2020
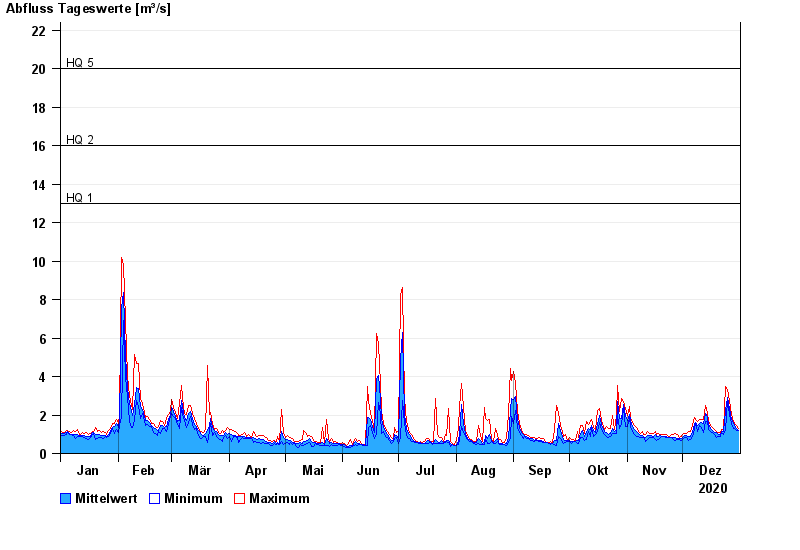
- HQ1 13 m³/s
- HQ2 16 m³/s
- HQ5 20 m³/s
- HQ10 24 m³/s
- HQ20 28 m³/s
- HQ50 34 m³/s
- HQ100 38 m³/s
| Date | Mean value [m³/s] | Maximum [m³/s] | Minimum [m³/s] |
|---|---|---|---|
| 31.12.2020 | 1.22 | 1.28 | 1.18 |
| 30.12.2020 | 1.32 | 1.47 | 1.18 |
| 29.12.2020 | 1.45 | 1.57 | 1.28 |
| 28.12.2020 | 1.59 | 1.68 | 1.28 |
| 27.12.2020 | 1.79 | 2.01 | 1.57 |
| 26.12.2020 | 2.36 | 2.77 | 2.01 |
| 25.12.2020 | 2.92 | 3.33 | 2.77 |
© Bayerisches Landesamt für Umwelt 2024