
- Start >
- Rivers >
- Discharge >
- Obere Donau >
- Roth >
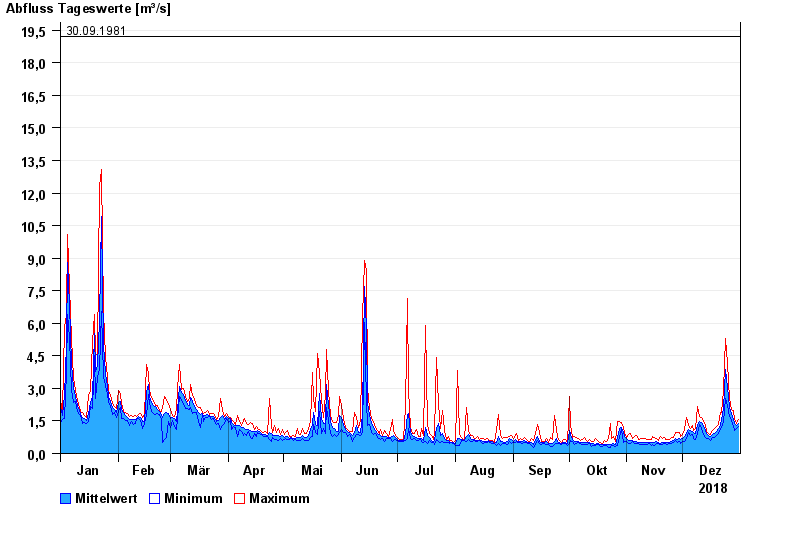
- Chart of year

Chart of year Roth / Roth
Discharge from 01.01.2018 to 31.12.2018
- 12.08.2002 Abfluss: 22,3 m³/s
- 08.12.2010 Abfluss: 21,3 m³/s
- 01.02.1982 Abfluss: 20 m³/s
- 10.03.2006 Abfluss: 19,6 m³/s
- 30.09.1981 Abfluss: 19,2 m³/s
| Date | Mean value [m³/s] | Maximum [m³/s] | Minimum [m³/s] |
|---|---|---|---|
| 31.12.2018 | 1.36 | 1.58 | 1.24 |
| 30.12.2018 | 1.31 | 1.4 | 1.16 |
| 29.12.2018 | 1.38 | 1.56 | 1.07 |
| 28.12.2018 | 1.56 | 1.98 | 1.25 |
| 27.12.2018 | 1.85 | 2.01 | 1.53 |
| 26.12.2018 | 2.13 | 2.55 | 1.72 |
| 25.12.2018 | 3.06 | 4.15 | 2.22 |
© Bayerisches Landesamt für Umwelt 2024