
- Start >
- Rivers >
- Discharge >
- Obere Donau >
- Roth >
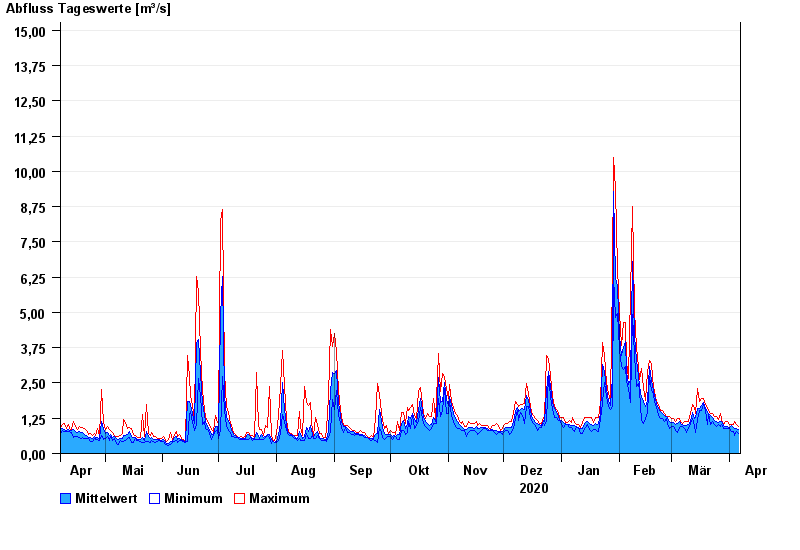
- Chart of year

Chart of year Roth / Roth
Discharge from 07.04.2020 to 06.04.2021
- 12.08.2002 Abfluss: 22,3 m³/s
- 08.12.2010 Abfluss: 21,3 m³/s
- 01.02.1982 Abfluss: 20 m³/s
- 10.03.2006 Abfluss: 19,6 m³/s
- 30.09.1981 Abfluss: 19,2 m³/s
| Date | Mean value [m³/s] | Maximum [m³/s] | Minimum [m³/s] |
|---|---|---|---|
| 06.04.2021 | 0.836 | 0.952 | 0.722 |
| 05.04.2021 | 0.901 | 1.04 | 0.795 |
| 04.04.2021 | 0.891 | 1.12 | 0.654 |
| 03.04.2021 | 0.926 | 1.04 | 0.795 |
| 02.04.2021 | 0.98 | 1.04 | 0.796 |
| 01.04.2021 | 0.93 | 1.04 | 0.872 |
| 31.03.2021 | 0.967 | 1.13 | 0.873 |
© Bayerisches Landesamt für Umwelt 2024