
- Start >
- Rivers >
- Discharge >
- Obere Donau >
- Roth >
- Chart of year

Chart of year Roth / Roth
Discharge from 26.05.2020 to 25.05.2021
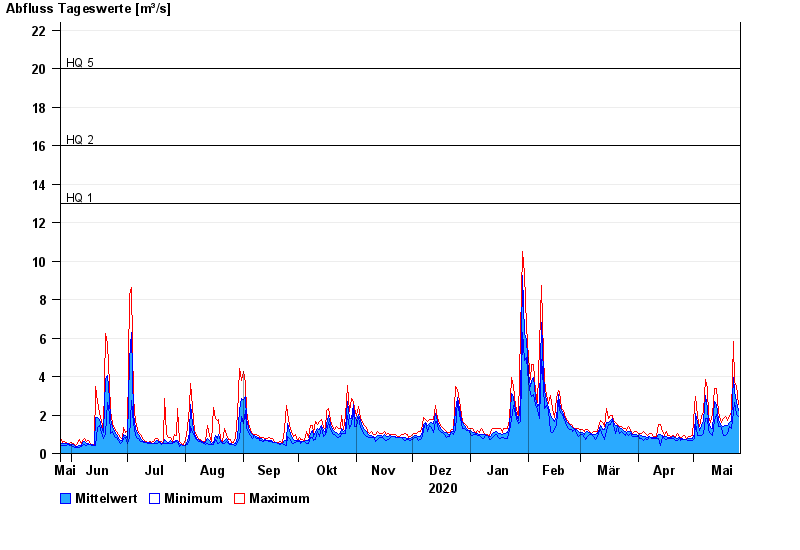
- HQ1 13 m³/s
- HQ2 16 m³/s
- HQ5 20 m³/s
- HQ10 24 m³/s
- HQ20 28 m³/s
- HQ50 34 m³/s
- HQ100 38 m³/s
| Date | Mean value [m³/s] | Maximum [m³/s] | Minimum [m³/s] |
|---|---|---|---|
| 25.05.2021 | 2.24 | 2.54 | 1.92 |
| 24.05.2021 | 2.69 | 3.52 | 2.04 |
| 23.05.2021 | 3.24 | 3.67 | 2.67 |
| 22.05.2021 | 3.96 | 5.82 | 2.17 |
| 21.05.2021 | 1.64 | 2.17 | 1.29 |
| 20.05.2021 | 1.6 | 1.93 | 1.39 |
| 19.05.2021 | 1.48 | 1.7 | 1.02 |
© Bayerisches Landesamt für Umwelt 2024