
- Start >
- Rivers >
- Discharge >
- Obere Donau >
- Remshart >
- Chart of year

Chart of year Remshart / Kammel
Discharge from 19.10.2019 to 18.10.2020
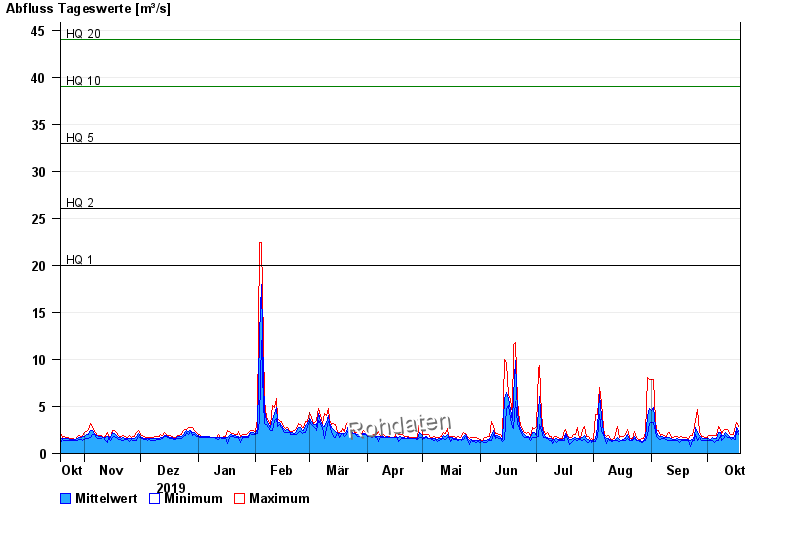
- HQ1 20 m³/s
- HQ2 26 m³/s
- HQ5 33 m³/s
- HQ10 39 m³/s
- HQ20 44 m³/s
- HQ50 52 m³/s
- HQ100 57 m³/s
| Date | Mean value [m³/s] | Maximum [m³/s] | Minimum [m³/s] |
|---|---|---|---|
| 18.10.2020 | 2.29 | 2.82 | 2.01 |
| 17.10.2020 | 2.8 | 3.28 | 2.4 |
| 16.10.2020 | 2.07 | 2.82 | 1.47 |
| 15.10.2020 | 1.71 | 2.01 | 1.57 |
| 14.10.2020 | 1.75 | 2.01 | 1.47 |
| 13.10.2020 | 1.83 | 2.13 | 1.68 |
| 12.10.2020 | 2.03 | 2.54 | 1.68 |
© Bayerisches Landesamt für Umwelt 2024